Updating search results...

Search Resources

215 Results

View
Selected filters:
  • data-analysis
Strategic Marketing Measurement
Conditional Remix & Share Permitted
CC BY-NC-SA
Rating
0.0 stars

Marketing research may be divided into methods that emphasize understanding “the customer” and methods that emphasize understanding “the market.” This course (15.822) deals with the market. The companion course (15.821) deals with the customer.
The course will teach you how to write, conduct and analyze a marketing research survey. The emphasis will be on discovering market structure and segmentation, but you can pursue other project applications.
A major objective of the course is to give you some “hands-on” exposure to analysis techniques that are widely used in consulting and marketing research factor analysis, perceptual mapping, conjoint, and cluster analysis). These techniques used to be considered advanced but now involve just a few keystrokes on most stat software packages.
The course assumes familiarity with basic probability, statistics, and multiple linear regression.

Subject:
Business and Communication
Marketing
Material Type:
Full Course
Provider Set:
MIT OpenCourseWare
Author:
Prelec, Drazen
Date Added:
09/01/2002
Syllabus:  Data Analytics
Conditional Remix & Share Permitted
CC BY-NC-SA
Rating
0.0 stars

Syllabus for the course "CSCI 381/780 - Data Analytics" delivered at Queens College in Spring 2019 by Kumar Ramansenthil as part of the Tech-in-Residence Corps program.

Subject:
Applied Science
Computer Science
Material Type:
Syllabus
Date Added:
02/15/2019
Syllabus:  Probability and Statistics for Computer Science
Conditional Remix & Share Permitted
CC BY-NC-SA
Rating
0.0 stars

Syllabus for the course "CSC 21700 - Probability and Statistics for Computer Science" delivered at the City College of New York in Spring 2019 by Evan Agovino as part of the Tech-in-Residence Corps program.

Subject:
Applied Science
Computer Science
Mathematics
Statistics and Probability
Material Type:
Syllabus
Date Added:
02/15/2019
Teaching Data Analysis in the Social Sciences: A case study with article level metrics
Conditional Remix & Share Permitted
CC BY-NC-SA
Rating
0.0 stars

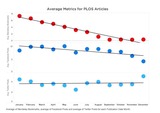
This case study is retrieved from the open book Open Data as Open Educational Resources. Case studies of emerging practice.

Course description:

Metrics and measurement are important strategic tools for understanding the world around us. To take advantage of the possibilities they offer, however, one needs the ability to gather, work with, and analyse datasets, both big and small. This is why metrics and measurement feature in the seminar course Technology and Evolving Forms of Publishing, and why data analysis was a project option for the Technology Project course in Simon Fraser University’s Master of Publishing Program.

The assignment:

“Data Analysis with Google Refine and APIs": Pick a dataset and an API of your choice (Twitter, VPL, Biblioshare, CrossRef, etc.) and combine them using Google Refine. Clean and manipulate your data for analysis. The complexity/messiness of your data will be taken into account”.

Subject:
Applied Science
Information Science
Social Science
Sociology
Material Type:
Case Study
Author:
Alessandra Bordini
Juan Pablo Alperin
Katie Shamash
Date Added:
03/27/2019
Teaching Principles Students How to Assess the State of the Economy
Conditional Remix & Share Permitted
CC BY-NC-SA
Rating
0.0 stars

Principles of economics students are asked to collect and analyze data on a few macro economic aggregates to give them a first taste of empirical work.

Subject:
Business and Communication
Economics
Mathematics
Social Science
Material Type:
Activity/Lab
Provider:
Science Education Resource Center (SERC) at Carleton College
Provider Set:
Quantitative Writing (SERC)
Author:
Steven Greenlaw
Date Added:
08/28/2012
"To Kill a Mockingbird": An Introduction to 1930s America
Unrestricted Use
Public Domain
Rating
0.0 stars

This activity teaches students about the setting of Harper Lee’s famous novel “To Kill a Mockingbird,” which takes place during 3 years (1933–1935) of the Great Depression. Part 1 of this activity can be used before students start reading the novel to help them understand what life was like in the 1930s. In this part, students will examine and answer questions about census documents that feature unemployment numbers and related information. Part 2 can be completed after students have read the first few chapters of the novel. In this part, students will write a piece using the RAFT technique (role, audience, format, topic) to show what they learned about the 1930s and what they have read so far.

Subject:
Mathematics
Statistics and Probability
Material Type:
Activity/Lab
Provider:
U.S. Census Bureau
Provider Set:
Statistics in Schools
Date Added:
10/18/2019
Toward Understanding the Role of Web 2.0 Technology in Self-Directed Learning and Job Performance in a Single Organizational Setting: A Qualitative Case Study, Online Submission, 2016-May
Only Sharing Permitted
CC BY-ND
Rating
0.0 stars

This single instrumental qualitative case study explores and thickly describes job performance outcomes based upon the manner in which self-directed learning activities of a purposefully selected sample of 3 construction managers are conducted, mediated by the use of Web 2.0 technology. The data collected revealed that construction managers are concerned with the performance expected of them, in addition to how well they perform their work-related activities (orientation to learning), indicating that organizations should provide guidelines on the use and expected outcomes of self-directed learning in addition to providing the tools, resources, and time (environmental factors) to match performance needs; construction managers feel that work-related activities expected of them, how well the work-related activities are performed, and consequences for poor performance at work are determining factors in selecting Web 2.0 technologies; while construction managers understand the need for rules restricting the use of Web 2.0 technologies in performing their jobs, they feel these rules do hinder their performance because access to specific information they need to answer a question, solve a problem, or research to learn something new is sometimes restricted; and successful performance outcomes are determined by compliance to expected performance behaviors of others, such as answering a question or solving a problem an architect or superintendent have presented, as well as expectations construction managers have set for themselves. The following are appended: (1) Call for Participation--Web 2.0 Technology Project; (2) Informed Consent Letter and Form/Template; (3) Semistructured Interview Guide; and (4) Permission to Conduct Research Study.

Subject:
Business and Communication
Career and Technical Education
Education
Electronic Technology
Management
Material Type:
Case Study
Author:
Caruso Shirley J
Date Added:
02/22/2022
Transitioning from Excel to MATLAB Diffusion Models
Conditional Remix & Share Permitted
CC BY-NC-SA
Rating
0.0 stars

This activity is part of a larger module that introduces students to two different ways to model chemical diffusion in minerals: 1) 1D diffusion in Excel using finite differences and 2) 1D diffusion in MATLAB using the same equations. It is designed to help students apply diffusion equations derived previously in class to understand natural zonation of elements in minerals. The students build the model first in Excel, and then in MATLAB to obtain the timescales of diffusive re-equilibration related to magma storage and transport at KÃÂlauea Volcano, Hawai'i. The major goals are to help students transition from visual platforms (e.g., Excel) to writing computer code (e.g., in MATLAB), implementing for loops for iterative calculations, and thinking about how the geologic parameters (temperature, pressure, fO2) affect the model results.

Subject:
Applied Science
Computer Science
Geology
Mathematics
Measurement and Data
Physical Science
Material Type:
Activity/Lab
Homework/Assignment
Provider:
Science Education Resource Center (SERC) at Carleton College
Provider Set:
Teach the Earth
Author:
Kendra Lynn
Date Added:
01/20/2023
Understanding Data
Read the Fine Print
Rating
0.0 stars

Data is all around us. Everything from the fitness tracker on your wrist to researchers at your local university are creating mountains of data — big data. What does all this data mean? And how can it help us answer important questions such as: What are the leading causes of heart disease? Or what patterns are related to higher pay at your job? Looking at data can help us answer fun questions too — who’s likely to win the next Super Bowl? Leave the boring lectures behind and intuitively learn data analysis through interactive exercises that allow you to play with fascinating real-world datasets. By the end of this course, you’ll be comfortable applying the basics of statistical analysis and econometrics. There are no prerequisites and we encourage you to repeat the interactive lessons as often as you need.

Subject:
Economics
Social Science
Material Type:
Full Course
Provider:
Marginal Revolution University
Author:
Thomas Stratmann
Date Added:
05/18/2017
Understanding the Air through Data Analysis
Read the Fine Print
Educational Use
Rating
0.0 stars

Students build on their existing air quality knowledge and a description of a data set to each develop a hypothesis around how and why air pollutants vary on a daily and seasonal basis. Then they are guided by a worksheet through an Excel-based analysis of the data. This includes entering formulas to calculate statistics and creating plots of the data. As students complete each phase of the analysis, reflection questions guide their understanding of what new information the analysis reveals. At activity end, students evaluate their original hypotheses and “put all of the pieces together.” The activity includes one carbon dioxide worksheet/data set and one ozone worksheet/data set; providing students and/or instructors with a content option. The activity also serves as a good standalone introduction to using Excel.

Subject:
Atmospheric Science
Physical Science
Material Type:
Activity/Lab
Provider:
TeachEngineering
Provider Set:
TeachEngineering
Author:
Ashley Collier
Ben Graves
Daniel Knight
Drew Meyers
Eric Ambos
Eric Lee
Erik Hotaling
Hanadi Adel Salamah
Joanna Gordon
Katya Hafich
Michael Hannigan
Nicholas VanderKolk
Olivia Cecil
Victoria Danner
Date Added:
02/17/2017
Unfolding the Mystery of Life, Biology Lab Manual for Non-Science Majors
Unrestricted Use
CC BY
Rating
0.0 stars

This laboratory manual is intended for use in a biology laboratory course taken by non-science majors, pre-biology, and pre-allied health majors.

Laboratory exercises provide students with experience in basic laboratory skills, gathering and organizing data, measuring and calculating, hypothesis testing, analysis of data, writing, and laboratory safety. The skill sets are designed to promote the development of critical thought and analysis. Students work with living and preserved specimens, and laboratory reagents and equipment.

Subject:
Biology
Life Science
Material Type:
Textbook
Author:
Ellen Genovesi
Laura Blinderman
Patrick Natale
Date Added:
07/16/2019
Unix Tools: Data, Software and Production Engineering
Conditional Remix & Share Permitted
CC BY-NC-SA
Rating
0.0 stars

Processing information is the hallmark of all modern organizations, which are increasingly digital: absorbing, processing and generating information is a key element of their business.
Being able to interact flexibly and efficiently with the underlying data and software systems is an indispensable skill. Knowledge of the Unix shell and its command-line tools boosts the effectiveness and productivity of software developers, IT professionals, and data analysts.

The Unix tools were designed, written, actively used and refined by the team that defined the modern computing landscape. They allow the performance of almost any imaginable computing task quickly and efficiently by judiciously combining key powerful concepts. The power of Unix tools for exploring, prototyping and implementing big data processing workflows, and software engineering tasks remains unmatched. Unix tools, running on hardware ranging from tiny IoT platforms to supercomputers, uniquely allow an interactive, explorative programming style, which is ideal for the efficient solution of many of the engineering and business analytics problems that we face every day.

Through the use of Unix tools:
- Software developers can quickly explore and modify code, data, and tests.
- IT professionals can scrutinize log files, network traces, performance figures, filesystems and the behavior of processes.
- Data analysts can extract, transform, filter, process, load, and summarize huge data sets.

The course is uniquely based on carefully-selected, interactive walk-through examples that demonstrate how each command operates in practice. The examples that we use involve problems that engineers and analysts face every day.

Subject:
Applied Science
Computer Science
Engineering
Material Type:
Full Course
Provider:
Delft University of Technology
Provider Set:
TU Delft OpenCourseWare
Author:
Diomidis Spinellis
Date Added:
01/16/2023
Using Census Data to Identify a Town's Housing Needs:  A Student/Faculty Collaborative Research and Service Learning Experience
Conditional Remix & Share Permitted
CC BY-NC-SA
Rating
0.0 stars

In this classroom project, students and faculty help a local housing non-profit identify area U.S. Census tracts most in need of its assistance in promoting decent and affordable homeownership to low- to moderate- income individuals. While this example describes an experience in a small, upper-level elective economics course, it includes suggestions for modifications of design and learning goals for other learning levels and environments.

Subject:
Economics
Social Science
Sociology
Material Type:
Activity/Lab
Teaching/Learning Strategy
Provider:
Science Education Resource Center (SERC) at Carleton College
Provider Set:
Teaching and Learning Economics (SERC)
Author:
Elizabeth Perry-Sizemore
Date Added:
08/28/2012
Using Interactive Maps to Interpret U.S. Territorial Expansion
Unrestricted Use
Public Domain
Rating
0.0 stars

Students will explore an interactive data visualization of state-by-state population growth as measured by the decennial censuses of 1790 through 2010. Students will also analyze and make inferences about the causes of more recent shifts in U.S. population.

Subject:
Mathematics
Statistics and Probability
Material Type:
Activity/Lab
Provider:
U.S. Census Bureau
Provider Set:
Statistics in Schools
Date Added:
10/15/2019
Using Publicly Available Data to Engage IV-E Students in Research and Statistics: Instructional Modules.
Conditional Remix & Share Permitted
CC BY-NC
Rating
0.0 stars

Increasingly, public agencies are adopting models of self-assessment in which administrative data are used to guide and then continuously evaluate the implementation of programs and policies. In California, public child welfare agencies track performance outcomes spanning a range of child safety, permanency, and well-being domains, as dictated by federal and state mandates. This curriculum has been designed to provide Title IV-E and others students interested in public child welfare systems with an overview of the state’s Child Welfare Outcomes and Accountability System. Students will be provided with hands-on opportunities to become experienced and “statistically literate” users of aggregate, public child welfare data from the state’s administrative child welfare system, attending to the often missing link between data/research and practice. This curriculum is organized into five teaching modules, providing instructors with student learning activities, PowerPoint slide presentations, and other materials to support graduate IV-E students in the development of practical data analysis skills. Materials focus on publicly available data hosted through the Child Welfare Indicators Project at the University of California at Berkeley, a long-standing agency/university data partnership: http://cssr.berkeley.edu/ucb_childwelfare. CalSWEC funding for the development of this curriculum was provided to the Child Welfare Performance Indicators Project. Modules were developed to support instructors of both first- and second-year MSW research courses. Module objectives include: (a) to support student (and instructor) understanding of California's child welfare system performance goals and progress to date; (b) to develop students who have highly desirable (and practical) data analysis skills, including the ability to intelligibly distill and present numerical findings; and (c) to prepare a cohort of IV-E MSW students equipped to adopt leadership roles in county child welfare agencies, bringing with them an appreciation for how data can be used to improve practice and inform policies. Putnam-Hornstein, E., Needell, B., Lery, B., King, B., & Weigmann, W. (2013).

Subject:
Social Work
Material Type:
Module
Author:
CalSWEC
Date Added:
02/26/2018
Using Student Data from Your Own College or University to Identify the Best Predictors of Student Success in College
Conditional Remix & Share Permitted
CC BY-NC-SA
Rating
0.0 stars

In this individual research project, a senior thesis student conducts a regression analysis that explores whether high school GPA or standardized test scores are better predictors of the cumulative GPAs of college graduates at her own university. The data are easily obtainable from the Office of Institutional Research. The project can be modified to be a group research project in a Research Methods Class or a Special Topics Upper Level Economics class.

Subject:
Economics
Social Science
Sociology
Material Type:
Activity/Lab
Teaching/Learning Strategy
Provider:
Science Education Resource Center (SERC) at Carleton College
Provider Set:
Teaching and Learning Economics (SERC)
Author:
Mary Borg
Date Added:
08/28/2012
Using enthalpy to assess fuel sources
Conditional Remix & Share Permitted
CC BY-NC-SA
Rating
0.0 stars

A variety of fuels are evaluated for the amount of heat they liberate upon burning. This includes a discussion of how different criteria can influence the evaluation of what makes a "good" fuel.

Subject:
Chemistry
Physical Science
Material Type:
Activity/Lab
Provider:
Science Education Resource Center (SERC) at Carleton College
Provider Set:
Starting Point (SERC)
Author:
Jeffrey Bodwin
Date Added:
08/28/2012
Using the Decennial Census to Draw Conclusions About American Life
Unrestricted Use
Public Domain
Rating
0.0 stars

Students will examine questions from 1940, 1960, and 2010 census questionnaires to analyze socioeconomic changes in the U.S. population before and after World War II.

Subject:
Mathematics
Statistics and Probability
Material Type:
Activity/Lab
Provider:
U.S. Census Bureau
Provider Set:
Statistics in Schools
Date Added:
10/18/2019
Voting Trends in America, 1964-2014
Unrestricted Use
Public Domain
Rating
0.0 stars

This activity is designed to be part of a unit on the U.S. Constitution, as it focuses on U.S. voting trends. Students will analyze bar and line graphs showing the percentages of people (by race, age, sex, region, and education) who voted in elections between 1964 and 2014. Students will use these data to respond to the question “Who votes in American elections?”

Subject:
Mathematics
Statistics and Probability
Material Type:
Activity/Lab
Provider:
U.S. Census Bureau
Provider Set:
Statistics in Schools
Date Added:
10/16/2019
Water Use and Conservation: Data Analysis for Central Tendency
Read the Fine Print
Educational Use
Rating
0.0 stars

Students collect a large set of data (approximately 60 sets) of individual student’s water use and learn how to use spreadsheets to graph the data and find mean, median, mode, and range. They compared their findings to the national average of water use per person per day and use it to evaluate how much water a municipality would need in the event of a recovery from a water shutdown. This analysis activity introduces students to the concept of central tendencies and how to use spreadsheets to find them.

Subject:
Mathematics
Numbers and Operations
Physical Science
Statistics and Probability
Material Type:
Activity/Lab
Provider:
TeachEngineering
Provider Set:
Activities
Author:
Jackie Gartner
Date Added:
08/01/2019