Updating search results...

Search Resources

3925 Results

View
Selected filters:
  • Science Education Resource Center (SERC) at Carleton College
Construction of Water Table Maps Using GIS
Conditional Remix & Share Permitted
CC BY-NC-SA
Rating
0.0 stars

Students create a water table map and flow net using water level data from seepage lakes in the Sand Hills of Nebraska. They then are able to make hypotheses regarding the chemistry of the lakes.

(Note: this resource was added to OER Commons as part of a batch upload of over 2,200 records. If you notice an issue with the quality of the metadata, please let us know by using the 'report' button and we will flag it for consideration.)
Subject:
Chemistry
Physical Science
Material Type:
Activity/Lab
Provider:
Science Education Resource Center (SERC) at Carleton College
Provider Set:
Teach the Earth
Author:
Bob Newton
Date Added:
08/17/2019
Construction of a Complex Machine Through Classroom Collaboration
Conditional Remix & Share Permitted
CC BY-NC-SA
Rating
0.0 stars

Successful completion of this cooperative learning activity requires the active involvement of the individual, the small group and the entire classroom (collaboration). The goal is to make a simple task as complicated as possible by constructing a single complex machine.

Subject:
Applied Science
Engineering
Physical Science
Physics
Material Type:
Activity/Lab
Assessment
Lesson Plan
Provider:
Science Education Resource Center (SERC) at Carleton College
Provider Set:
Pedagogy in Action
Author:
Joe Gartner
Date Added:
12/09/2011
Construction of a Korjinski Diagram
Conditional Remix & Share Permitted
CC BY-NC-SA
Rating
0.0 stars

An interactive powerpoint presentation walks students step-by-step through the process of generating a Korjinski diagram for the system K20-Al2O3-SiO2. Students will use the triangular diagram from the previous exercise to determine which minerals have stability boundaries on the diagram. A second tutorial explains how to plot a natural water composition on the diagram. A Word document provides the thermodynamic data and instructions necessary to create their own diagram for the Ca0-MgO-SiO2 system. An answer key is also provided.

Subject:
Geology
Physical Science
Material Type:
Activity/Lab
Homework/Assignment
Provider:
Science Education Resource Center (SERC) at Carleton College
Provider Set:
Teach the Earth
Author:
Terri Woods
Date Added:
01/20/2023
Construction of a Simple Conceptual Model
Conditional Remix & Share Permitted
CC BY-NC-SA
Rating
0.0 stars

This homework assignment is designed to give the students practice in developing a simple conceptual model using reservoirs, fluxes, and simple calculations of sediment, carbon and nutrient accumulation in a typical reservoir/river system. This assignment is typically used after an introductory lecture to biogeochemical cycles and gives the students a concrete example of nutrient and sediment issues in surface water systems.

(Note: this resource was added to OER Commons as part of a batch upload of over 2,200 records. If you notice an issue with the quality of the metadata, please let us know by using the 'report' button and we will flag it for consideration.)
Subject:
Business and Communication
Career and Technical Education
Chemistry
Environmental Studies
Hydrology
Management
Physical Science
Political Science
Social Science
Material Type:
Activity/Lab
Provider:
Science Education Resource Center (SERC) at Carleton College
Provider Set:
Teach the Earth
Author:
Scott Werts
Date Added:
05/04/2021
Construction of a Triangular Stability Diagram
Conditional Remix & Share Permitted
CC BY-NC-SA
Rating
0.0 stars

An interactive powerpoint presentation walks students step-by-step through the process of generating a triangular diagram for the system K2O-Al2O3-SiO2. A Word document provides the thermodynamic data and instructions necessary to create their own diagram for the CaO-MgO-SiO2 system. An answer key is also provided.
Students will:
- Calculate mineral compositions in mole percent and plot on a triangular diagram.
- Determine which is the stable mineral at the apices.
- Draw in all possible tie-lines connecting coexisting minerals.
- Eliminate unstable collinear phases.
- Eliminate crossing tie-lines.
- Determine stable mineral assemblages for bulk-rock compositions provided.

Subject:
Geology
Physical Science
Material Type:
Activity/Lab
Homework/Assignment
Provider:
Science Education Resource Center (SERC) at Carleton College
Provider Set:
Teach the Earth
Author:
Terri Woods
Date Added:
01/20/2023
Construisez la pyramide du dÃveloppement durable! - An Online Game on Sustainable Development
Conditional Remix & Share Permitted
CC BY-NC-SA
Rating
0.0 stars

This online quiz on sustainable development can be used in French language classes to prepare intermediate-level students for discussions on environmental topics. The resource is excellent for immersion and content-based instruction.

Subject:
Applied Science
Arts and Humanities
Ecology
Environmental Science
Geoscience
Languages
Life Science
Physical Science
Material Type:
Activity/Lab
Provider:
Science Education Resource Center (SERC) at Carleton College
Provider Set:
Pedagogy in Action
Author:
Laura Franklin
Date Added:
11/06/2014
Consumer Testing and the Scientific Method
Conditional Remix & Share Permitted
CC BY-NC-SA
Rating
0.0 stars

Using paper towels this activity introduces using the scientific method to set up and test and experiment.

Subject:
Chemistry
Physical Science
Material Type:
Activity/Lab
Provider:
Science Education Resource Center (SERC) at Carleton College
Provider Set:
Pedagogy in Action
Author:
Kathy Oellerich
Date Added:
08/10/2012
Contemporary Climate Oscillations: ENSO and a case study of the Huanghe River
Conditional Remix & Share Permitted
CC BY-NC-SA
Rating
0.0 stars

This module uses data of monthly mean sea level pressure from Tahiti and Darwin, Australia to calculate the Southern Oscillation Index (SOI) of El Nino-Southern Oscillation (ENSO) for comparison with the Huanghe River (China) discharge and correlated anthropogenic effects.

Subject:
Applied Science
Environmental Science
Material Type:
Activity/Lab
Provider:
Science Education Resource Center (SERC) at Carleton College
Provider Set:
Teach the Earth
Author:
Steve Kuehl
Date Added:
01/20/2023
Context Rich Problem: Changes in Demand
Conditional Remix & Share Permitted
CC BY-NC-SA
Rating
0.0 stars

Context Rich Problem on demand shifters and the implications of such a shift.

Subject:
Business and Communication
Economics
Social Science
Material Type:
Activity/Lab
Provider:
Science Education Resource Center (SERC) at Carleton College
Provider Set:
Teaching and Learning Economics (SERC)
Author:
Rochelle Ruffer
Date Added:
08/28/2012
Context Rich Problem: Price Ceiling
Conditional Remix & Share Permitted
CC BY-NC-SA
Rating
0.0 stars

In this context rich problem, students are asked to analyze the effects of a price ceiling.

Subject:
Business and Communication
Economics
Social Science
Material Type:
Activity/Lab
Provider:
Science Education Resource Center (SERC) at Carleton College
Provider Set:
Teaching and Learning Economics (SERC)
Author:
Rochelle Ruffer
Date Added:
08/28/2012
Context-Rich Problem for Cooperative Group Problem Solving - Electric Force
Conditional Remix & Share Permitted
CC BY-NC-SA
Rating
0.0 stars

Context-rich problem for electrostatics in an introductory physics class. The instructional setting uses cooperative group problem solving.

Subject:
Physical Science
Physics
Material Type:
Activity/Lab
Provider:
Science Education Resource Center (SERC) at Carleton College
Provider Set:
Teaching and Learning Economics (SERC)
Author:
Kenneth Heller
Date Added:
08/28/2012
Continental Crust Mass Balance Calculation
Conditional Remix & Share Permitted
CC BY-NC-SA
Rating
0.0 stars

A quantitative skills-intensive exercise using data from the Mineral Mountains, Utah, to calculate mass balance and to address the "space problem" involved with emplacing plutons into the crust.

(Note: this resource was added to OER Commons as part of a batch upload of over 2,200 records. If you notice an issue with the quality of the metadata, please let us know by using the 'report' button and we will flag it for consideration.)

Subject:
Biology
Chemistry
Geology
Geoscience
Life Science
Mathematics
Measurement and Data
Physical Science
Statistics and Probability
Material Type:
Activity/Lab
Provider:
Science Education Resource Center (SERC) at Carleton College
Provider Set:
Teach the Earth
Author:
Jennifer Wenner
Date Added:
08/23/2019
Continental Glaciation - Landforms
Conditional Remix & Share Permitted
CC BY-NC-SA
Rating
0.0 stars

To prepare for this exercise, students participate in a teacher-led discussion about processes of erosion and deposition in different environments under and around continental ice sheets. They then work in small groups of 2-3 to examine stereopairs of examples of landforms representative of subglacial and end-glacial settings. The culminating set of questions require them to find and analyze the sequence of formation of a dozen or so landforms from different glacial environments scattered over one topographic quadrangle.
Designed for a geomorphology course
Has minimal/no quantitative component

(Note: this resource was added to OER Commons as part of a batch upload of over 2,200 records. If you notice an issue with the quality of the metadata, please let us know by using the 'report' button and we will flag it for consideration.)
Subject:
Biology
Life Science
Material Type:
Activity/Lab
Provider:
Science Education Resource Center (SERC) at Carleton College
Provider Set:
Teach the Earth
Author:
Rich Whittecar
Date Added:
09/02/2019
Contour Mapping With Playdough
Conditional Remix & Share Permitted
CC BY-NC-SA
Rating
0.0 stars

Students measuring elevations in a model map area.

Provenance: Lynne Elkins, University of Nebraska at Lincoln
Reuse: This item is offered under a Creative Commons Attribution-NonCommercial-ShareAlike license http://creativecommons.org/licenses/by-nc-sa/3.0/ You may reuse this item for non-commercial purposes as long as you provide attribution and offer any derivative works under a similar license.
This exercise was designed in a department that has some basic support for developing inexpensive classroom equipment in cooperation with a machine shop. The shop built gridded mapping frames to my specifications using a simple aluminum design (a square frame of aluminum with small pins inserted at one-inch intervals). An even simpler DIY design could use thin but sturdy pieces of wood to create a wooden frame, with steel nails. My initial design called for 2'x2' frames, which turned out to be too large: mapping a 4 sq. ft. space at 1-inch resolution took more than a standard lab period for most students to complete. The attached exercise instructs students to use a smaller portion of the mapping grid; this can be revised for different size grids. Another issue to be aware of when designing mapping grid frames is whether to label the spaces with letters and numbers (as is done on many maps and was thus my original thinking) or to label the lines between the spaces, which is easier for data collection.


At the start of the lab, I typically give my students a few ground rules: they should avoid extremely flat areas, because the elevation rounding they are likely to do will make contouring them very difficult; their highest point should be at least 2 inches and not more than 4-5 inches high; they may not have vertical walls or overhangs (and should really keep the slopes less than 60-70Â at their steepest); the table surface is sea level with zero elevation; and most of their model area must be mappable land (not ocean, i.e. bare table). I give them large sheets of wax paper to construct the model on, for easy cleanup. I also provide large sheets of 1" grid paper so they can create a 1:1 map of their model (and I impose a scale calculation later for the model), and remind them several times not to invert the map labels when setting up their map grid. Typically this is all they need to know to begin creating and mapping a landscape. The mapping tools are pieces of string (to string across the pins on the mapping frames and position the grid points) and wooden skewers labeled with quarter-inch markings.


After an initial attempt to make the playdough for this lab, my department opted to purchase 6-lb. tubs of commercial playdough. It is ultimately relatively inexpensive because it is reusable almost indefinitely, as long as it is stored tightly sealed (we use zip-loc bags inside the commercial containers) and occasionally spritzed with water--once a year usually works fine for keeping it hydrated for storage over the rest of the year, but that may vary with climate and frequency of use. Typically I walk around while they are getting started and make commentary on their landscapes, and then when there are no further questions I go to the board and create an example data set and contour map. While a photocopied paper example map would accomplish the same thing, this approach lets me tailor my examples to what I see they are doing (e.g., including circular depressions, saddles, or ridges). I also have handy and frequently refer the students to USGS quads from around the country when they are mapping, e.g. a very flat quad with depressions in central Florida and a very steep quad from the Grand Canyon.


When they are mapping, I typically advise them to 1) sketch in the shoreline around their zero-elevation values by comparing to the model, 2) add major peaks between grid lines as needed, and 3) map from the highest parts of their map area downward. I also discourage contour intervals smaller than 1/2-inch, particularly when their model contains flat terrain. Many students want to be more precise, and if they have estimated depths to the nearest 1/8-inch it is possible to contour at 1/4-inch intervals, but typically their rounded measurements in flat areas make this quite tricky. It often is necessary for me (and/or TAs) to walk around and give them advice in places they are stuck and remind them how contours work.


Making the profile is usually very quick. The graph provided would need to be adjusted/replaced for different size mapping grids, but works well for a grid that runs from A to O on one side and from 1 to 10+ on the other.


If they are kept on task everyone except the most cautious or disorganized groups can typically finish elevation measurements for about 2 sq. ft. of map area within 1.5 hours. With an introductory spiel, that leaves about an hour for finishing most of the contouring and transferring data for the profile. Faster groups will probably finish all the final details but are well-advised to take the lab home to double check the details. Slower groups may finish coloring and looking at the local topo map on their own. Longer lab periods would permit a more detailed study of the local USGS maps and/or a larger model size--this was written for a 3-hour lab period.

(Note: this resource was added to OER Commons as part of a batch upload of over 2,200 records. If you notice an issue with the quality of the metadata, please let us know by using the 'report' button and we will flag it for consideration.)

Subject:
Biology
Life Science
Material Type:
Activity/Lab
Provider:
Science Education Resource Center (SERC) at Carleton College
Provider Set:
Teach the Earth
Author:
Lynne Elkins
Date Added:
03/03/2022
Contractional Strain
Conditional Remix & Share Permitted
CC BY-NC-SA
Rating
0.0 stars

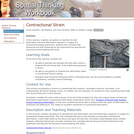
Students use gesture to describe the bulk deformation and local deformation apparent in images of a contractional analog experiment. Students then calculate bulk shortening and bulk thickening for the experiment and describe the structures accommodating that strain.

(Note: this resource was added to OER Commons as part of a batch upload of over 2,200 records. If you notice an issue with the quality of the metadata, please let us know by using the 'report' button and we will flag it for consideration.)

Subject:
Biology
Geoscience
Life Science
Mathematics
Measurement and Data
Physical Science
Statistics and Probability
Material Type:
Activity/Lab
Provider:
Science Education Resource Center (SERC) at Carleton College
Provider Set:
Teach the Earth
Author:
Carol Ormand
Date Added:
09/01/2022
Contrails or Chemtrails?
Conditional Remix & Share Permitted
CC BY-NC-SA
Rating
0.0 stars

Using multi-media and basic atmospheric physics, students investigate contrails and chemtrails. Students apply previous learning about pseudoscience, and couple that with an understanding of the atmosphere to reach a decision about chemtrails. Students write an analysis paper on the issue of chemtrails, followed by a decision paper about whether society should be concerned about chemtrails.

Subject:
Applied Science
Atmospheric Science
Information Science
Physical Science
Material Type:
Activity/Lab
Homework/Assignment
Provider:
Science Education Resource Center (SERC) at Carleton College
Provider Set:
Teach the Earth
Author:
Blair Larsen
Date Added:
01/20/2023
Controls on the Development of Rock Weathering Pits
Conditional Remix & Share Permitted
CC BY-NC-SA
Rating
0.0 stars

Weathering pits are well known from granite terrains and they also form in metaquartzite along the Blue Ridge Parkway in North Carolina. We will drive to Flat Rock Trail, along the Blue Ridge Parkway near Linville, NC. After a short hike up the trail we will observe the weathering pits exposed on the bedrock surface overlooking the Linville Valley. Each group of students will write down 3 hypotheses for how and why they form. Consider what factors control the size and shape of the pits. Collect data that can be used to test the hypotheses including orientation, size, and shape. Plot the data collected in the field. Present data on graphs and charts. Do trends in the data support one hypothesis over another?
Designed for a geomorphology course

(Note: this resource was added to OER Commons as part of a batch upload of over 2,200 records. If you notice an issue with the quality of the metadata, please let us know by using the 'report' button and we will flag it for consideration.)
Subject:
Biology
Life Science
Material Type:
Activity/Lab
Provider:
Science Education Resource Center (SERC) at Carleton College
Provider Set:
Teach the Earth
Author:
Ellen Cowan
Date Added:
08/24/2019
Converging Tectonic Plates Demonstration
Conditional Remix & Share Permitted
CC BY-NC-SA
Rating
0.0 stars

During this demo, participants use springs and a map of the Pacific Northwest with GPS vectors to investigate the stresses and surface expression of subduction zones, specifically the Juan de Fuca plate diving beneath the North American plate.

(Note: this resource was added to OER Commons as part of a batch upload of over 2,200 records. If you notice an issue with the quality of the metadata, please let us know by using the 'report' button and we will flag it for consideration.)
Subject:
Biology
Life Science
Mathematics
Measurement and Data
Statistics and Probability
Material Type:
Activity/Lab
Homework/Assignment
Provider:
Science Education Resource Center (SERC) at Carleton College
Provider Set:
Teach the Earth
Author:
Shelley Olds
Date Added:
08/27/2022
Cooperative Learning Exercises to Teach the Gains from Trade
Conditional Remix & Share Permitted
CC BY-NC-SA
Rating
0.0 stars

This is a cooperative learning exerise that allows students to learn about comparative advantage and the gains from trade.

Subject:
Economics
Social Science
Material Type:
Activity/Lab
Provider:
Science Education Resource Center (SERC) at Carleton College
Provider Set:
Pedagogy in Action
Author:
Dan Marburger
Date Added:
11/06/2014