This case study is intended to develop an awareness of the ethical …
This case study is intended to develop an awareness of the ethical and privacy implications for the creation, sharing, interpretation, and use of geocoded data, that is, data with locational content. It provides a set of relevant ethical and legal standards, along with a fact-rich hypothetical. By applying those standards to the hypothetical, learners from a variety of backgrounds are offered the opportunity to develop an awareness of the potential for unintended and negative consequences to result from geocoded data practices that appear, in isolation, to be unproblematic.
(Note: this resource was added to OER Commons as part of a batch upload of over 2,200 records. If you notice an issue with the quality of the metadata, please let us know by using the 'report' button and we will flag it for consideration.)
In this guided research and critical thinking activity, students prepare a research …
In this guided research and critical thinking activity, students prepare a research paper comprised of two parts: 1) a "state-of-the-science" review and synthesis of selected literature from risk and resilience research (provided) and 2) a brief critical appraisal of how current knowledge is (or could be) applied to building disaster resilience in a real-world scenario. Part 2 will be set in a student-selected hazard context (coastal hazards, flooding, or earthquake), employment sector (academia, government, private industry, services, non-profit), and geopolitical sphere of influence (e.g., Resilience to earthquake disaster in the student population at Universidad de Lima, Peru).
(Note: this resource was added to OER Commons as part of a batch upload of over 2,200 records. If you notice an issue with the quality of the metadata, please let us know by using the 'report' button and we will flag it for consideration.)
We introduced a new required course "EnSc 210: Issues in Environmental Science" …
We introduced a new required course "EnSc 210: Issues in Environmental Science" for our majors about three years ago. When I was assigned to teach this course for the first time, I struggled with developing a syllabus and recommending a text for the course. Since we also offer classes in "Environmental Geology" and an introductory course "EnSc 110 Understanding the Earth," the challenge was to avoid duplication while developing an appropriate syllabus. What I finally decided to do was to have students provide ideas. So, on the first day of class I announced that we don't have a syllabus for this course (many sighs of disappointment) and, after a brief remark on some current environmental issues, invited each student to suggest at least one topic for inclusion in the course. After some hesitation (as expected) hands went up and I began writing each topic on the white board. Pretty soon we had 20-25 topics with some overlapping themes. Some of these included: population problem, global climate change, air and water pollution, waste management, environmental health, species decline, environmental impact of large dams, and sustainability. After some discussions about relative importance of various topics and the time available to cover each during the semester, we narrowed it down to about 10 topics for detailed study. I prepared my syllabus (linked below) based on this list which worked very well because: we were able to include key topics and, very importantly, students felt a sense of 'ownership' which led to a very interesting and interactive class experience throughout the semester.
(Note: this resource was added to OER Commons as part of a batch upload of over 2,200 records. If you notice an issue with the quality of the metadata, please let us know by using the 'report' button and we will flag it for consideration.)
This site from the National Park Service briefly addresses the geology of …
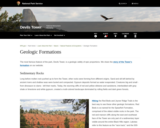
This site from the National Park Service briefly addresses the geology of Devil's Tower. The evolution of various theories on the formation of the tower are discussed. A slide show of the emplacement of the tower is also available.
To complete this assignement student have to work in groups to answer …
To complete this assignement student have to work in groups to answer a series of questions on the evolution of land plants. They need to combine material previously covered in lecture and information from the WWW to determine how the evolution of land plants changed the lithosphere, atmophere, and biosphere.
After completing the attached exercise the students participate in a guided discussion. There are several way to divide students up into groups.
Different groups are asked to summarize: the link between the spread of land plants and
1) atmospheric carbon levels and climatic conditions,
2) organic carbon and dissolved oxygen levels in the ocean
3) the abundance of corals and other marine animals: shallow vs. deep ocean
4) Erosion rates on land and rates of organic matter burial in the oceans.
5) General patterns in diversity and biomass of marine and terrestrial fauna
Then each group is asked to discuss how the aspect they considered about the Devonian Extinction fits into and differs from conditions we see in the modern carbon cycle.
(Note: this resource was added to OER Commons as part of a batch upload of over 2,200 records. If you notice an issue with the quality of the metadata, please let us know by using the 'report' button and we will flag it for consideration.)
Landslide between Highway 7 and the Susquehanna River (42.4947º N, 74.98212º W). …
Landslide between Highway 7 and the Susquehanna River (42.4947º N, 74.98212º W). Although, this exercise may be adapted elsewhere. An active, large active hillslope is required, preferably one close to infrastructure, and one which students can access safely. The following features are not uncommon, and make the problem richer: a river bend at the toe of the hillslope; a gas or water line routed through the slide; a hillslope exhibiting numerous scales of movements, from small debris flows a few cm wide to large rotational slides; and nearby infrastructure, such as buildings or roads.
(Note: this resource was added to OER Commons as part of a batch upload of over 2,200 records. If you notice an issue with the quality of the metadata, please let us know by using the 'report' button and we will flag it for consideration.)
The overarching goal of this exercise is for students to explore the …
The overarching goal of this exercise is for students to explore the early anthropogenic hypothesis, which claims that early agriculture had a substantial impact on greenhouse gases and global climate thousands of years ago (Ruddiman, 2003). Students compare changes in greenhouse gas concentrations that occurred thousands of years ago to more recent changes that occurred over hundreds of years. Students also relate changes in greenhouse gas concentrations to warming. The exercise is completed over a 1.5- to 2-week period as the class covers a chapter on climate change.
(Note: this resource was added to OER Commons as part of a batch upload of over 2,200 records. If you notice an issue with the quality of the metadata, please let us know by using the 'report' button and we will flag it for consideration.)
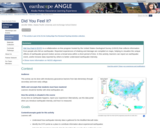
Did you have an earthquake where you live and want to participate …
Did you have an earthquake where you live and want to participate in Community Science? Would you like students to better understand how earthquake intensity is determined? This guide provides ideas about how you can incorporate the online USGS tool: Did You Feel It? into your classroom.
(Note: this resource was added to OER Commons as part of a batch upload of over 2,200 records. If you notice an issue with the quality of the metadata, please let us know by using the 'report' button and we will flag it for consideration.)
Some of the Viking images sent back from Mars in the 1970s …
Some of the Viking images sent back from Mars in the 1970s show tantalizing evidence of dendritic valley networks in some of the oldest terrains on the planet. One of the big questions ever since has been whether it might have rained early in Mars history.
One of the ways of deciding whether the Mars valley networks might have been produced by rainfall is to find out how similar they are to valley networks on Earth, which we know are produced by rainfall. The standard method for analyzing drainage basins is comparison of the number of drainage segments per square kilometer (drainage density) and how extensively branched the network is (stream order).
In this exercise, students calculate stream order for valley segments mapped by Hynek and Phillips (2003) using MOC/MOLA data. Students then use data on valley segment length and drainage basin area from Hynek and Phillips (2003) to calculate drainage density. They compare stream order and drainage density for the Mars site with similar calculations for areas on Earth and evaluate the question of whether valley networks on Mars might be consistent with rainfall on an early Mars, and what the uncertainties and limitations are in their conclusions.
(Note: this resource was added to OER Commons as part of a batch upload of over 2,200 records. If you notice an issue with the quality of the metadata, please let us know by using the 'report' button and we will flag it for consideration.)
This is a several week activity in which students evaluate the differential …
This is a several week activity in which students evaluate the differential taphonomy of shells tumbled in carbonate sand as compared to silica sand.
(Note: this resource was added to OER Commons as part of a batch upload of over 2,200 records. If you notice an issue with the quality of the metadata, please let us know by using the 'report' button and we will flag it for consideration.)
In this interactive demonstration students will make observations of diffusion of a …
In this interactive demonstration students will make observations of diffusion of a semi permeable membrane and be able to compare these observations to the functions of a cell membrane.
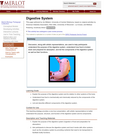
The digestive system is investigated in this learning activity to help participants …
The digestive system is investigated in this learning activity to help participants learn how food is broken down and prepared for absorption, and list the components of the digestive system as well as their functions. Organs investigated include the mouth, esophagus, stomach, small intestine, large intestine, rectum, and anus.
"Digging for Fossils": A student laboratory activity (Note: this resource was added …
"Digging for Fossils": A student laboratory activity
(Note: this resource was added to OER Commons as part of a batch upload of over 2,200 records. If you notice an issue with the quality of the metadata, please let us know by using the 'report' button and we will flag it for consideration.)
This lab activity is a paper fossil dig where students discover skeletal …
This lab activity is a paper fossil dig where students discover skeletal characteristics of humans, primates and hominids and are asked to make a short oral presentation to the class.
Spreadsheets Across the Curriculum module. Students analyze a given data set to …
Spreadsheets Across the Curriculum module. Students analyze a given data set to understand the "Digital Divide" by means of percentages and the Subtotal tool in Excel.
An understanding of the microscale structure and composition of sedimentary rocks is …
An understanding of the microscale structure and composition of sedimentary rocks is of undiminished importance in diverse fields (e.g., microscale chemical analysis cannot proceed without petrography), yet the curriculum is no longer offering undergraduates the opportunity to develop sufficient expertise. In an effort to bolster the exposure of undergraduates to sedimentary petrology, the Tutorial Petrographic Image Atlas was created. The basic components of the tutorial are petrographic images that are viewed in a static mode (no rotation, no animation, no timed observation). Text boxes relating to identification of components within the image are attached to specific mapped regions of the image. Both the mapped regions and the text are invisible until the student points and clicks on an active region of the image. In essence, the student must 'ask', "What is that?" Information ranges from simple one word identifications to lengthy paragraphs explaining the finer points of why something is what it is.
This is a highly interactive digital product that attempts to recreate certain elements of the laboratory petrographic experience including: a sense of exploration; high-quality petrographic images; a visual field dominated by the image; multiple examples of features viewed in diverse contexts; rich content relating to the identification and significance of features; active, inquiry-based learning.
Unlike real-time laboratory experiences with the petrographic microscope, the digital tutorial can be used at any time and place that a computer is available, does not require the presence of a microscope or samples or an expert, can be viewed repeatedly, has the technical content integrated with the image, gives the student undivided "attention" (unlike the TA, it doesn't wander to the other side of the lab), and rarely gives answers unless "asked."
(Note: this resource was added to OER Commons as part of a batch upload of over 2,200 records. If you notice an issue with the quality of the metadata, please let us know by using the 'report' button and we will flag it for consideration.)
This project is designed based on 21st century skills and to help …
This project is designed based on 21st century skills and to help students engage in, experience, explore and evolve science. As a part of the activity students create a digital poster (infographic) using free online websites, such as: Piktochart, Checkthis, Glogster, Infogram, Easelly, Visually. They are not allowed to use powerpoint, learning to use these websites is one of the objectives of the activity. Students are provided information on Copyright protection and Creative Commons, Referencing and Grading Criteria of the digital poster. Students are assigned one mineral and 1 rock from each category of igneous, sedimentary and metamorphic to describe on the digital poster. Information provided in the textbook and power points such as physical and chemical properties ( included but not limited to: chemical composition, density, texture, color, etc.) and 1 or 2 images of each sample should be included on the poster. Also they are advised to add the most common uses of the samples or any other information that they find interesting, which they may find this information in class material or they may have to do a little research. If they use sources other than class material, they need to cite their references.
The activity is designed to help students conceptualize the spatiotemporal relationships between …
The activity is designed to help students conceptualize the spatiotemporal relationships between erosion and deposition across a convex topography, which serves as a proxy for understanding rill and gully formation, knickpoint migration, valley excavation, and the interplay between sediment supply and accommodation across distributary features. The exercise utilizes simplistic flume observations and measurements to generate digital terrain models (DTMs) of generated topographies; by changing individual flume parameters between experimental runs (such as discharge, slope, and sediment type and moisture content), students are able to determine controls on sediment dispersion.
The purpose of this week's lab is to - prepare calibration standards …
The purpose of this week's lab is to - prepare calibration standards - use a UV-Vis spectrometer to determine the spectral peaks for several dye solutions, and create a calibration curve - calculate how much of each single-element standard solution is needed to make a multi-element stock solution
(Note: this resource was added to OER Commons as part of a batch upload of over 2,200 records. If you notice an issue with the quality of the metadata, please let us know by using the 'report' button and we will flag it for consideration.)
This is an online learning experience that transports learners around the world …
This is an online learning experience that transports learners around the world to different locations related to the Cretaceous -- Paleogene (K -- Pg) extinction event. Students will collect and analyze evidence to explain how natural events impact life on Earth. The KPg extinction event, which occurred 66 mya, caused the mass extinction of nearly 75% of the plant and animal species on Earth, including the dinosaurs. It is marked by a thin layer of sediment which can be found throughout the world in marine and terrestrial rocks.
(Note: this resource was added to OER Commons as part of a batch upload of over 2,200 records. If you notice an issue with the quality of the metadata, please let us know by using the 'report' button and we will flag it for consideration.)
No restrictions on your remixing, redistributing, or making derivative works. Give credit to the author, as required.
Your remixing, redistributing, or making derivatives works comes with some restrictions, including how it is shared.
Your redistributing comes with some restrictions. Do not remix or make derivative works.
Most restrictive license type. Prohibits most uses, sharing, and any changes.
Copyrighted materials, available under Fair Use and the TEACH Act for US-based educators, or other custom arrangements. Go to the resource provider to see their individual restrictions.