Data Carpentry lesson from Ecology curriculum to learn how to analyse and …
Data Carpentry lesson from Ecology curriculum to learn how to analyse and visualise ecological data in R. Data Carpentry’s aim is to teach researchers basic concepts, skills, and tools for working with data so that they can get more done in less time, and with less pain. The lessons below were designed for those interested in working with ecology data in R. This is an introduction to R designed for participants with no programming experience. These lessons can be taught in a day (~ 6 hours). They start with some basic information about R syntax, the RStudio interface, and move through how to import CSV files, the structure of data frames, how to deal with factors, how to add/remove rows and columns, how to calculate summary statistics from a data frame, and a brief introduction to plotting. The last lesson demonstrates how to work with databases directly from R.
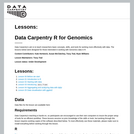
Python is a general purpose programming language that is useful for writing …
Python is a general purpose programming language that is useful for writing scripts to work effectively and reproducibly with data. This is an introduction to Python designed for participants with no programming experience. These lessons can be taught in a day (~ 6 hours). They start with some basic information about Python syntax, the Jupyter notebook interface, and move through how to import CSV files, using the pandas package to work with data frames, how to calculate summary information from a data frame, and a brief introduction to plotting. The last lesson demonstrates how to work with databases directly from Python.
Short Description: Data analytics is a rapidly evolving field. In today's labour …
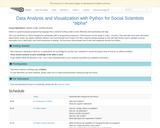
Short Description: Data analytics is a rapidly evolving field. In today's labour market, knowing how to acquire, process, and interpret large amounts of data to make optimal decisions is crucial for many professionals, especially those in business and engineering. This open textbook, "a new online course" if you will, focuses on three key concept areas: data acquisition, data processing, and decision-making models. In this course, students will be able to develop advanced knowledge and skills to acquire related data for operations of business or projects; apply quantitative literacy skills such as statistics and machine learning; and use predictive or prescriptive modeling to make timely, actionable, and meaningful decisions.
Long Description: Data analytics is a rapidly evolving field. In today’s labour market, knowing how to acquire, process, and interpret large amounts of data to make optimal decisions is crucial for many professionals, especially those in business and engineering. This open textbook, “a new online course” if you will, focuses on three key concept areas: data acquisition, data processing, and decision-making models. In this course, students will be able to develop advanced knowledge and skills to acquire related data for operations of business or projects; apply quantitative literacy skills such as statistics and machine learning; and use predictive or prescriptive modeling to make timely, actionable, and meaningful decisions.
Word Count: 2054
(Note: This resource's metadata has been created automatically by reformatting and/or combining the information that the author initially provided as part of a bulk import process.)
Short Description: Data analytics is a rapidly evolving field. In today's labour …
Short Description: Data analytics is a rapidly evolving field. In today's labour market, knowing how to acquire, process, and interpret large amounts of data to make optimal decisions is crucial for many professionals, especially those in business and engineering. This open textbook, "a new online course" if you will, focuses on three key concept areas: data acquisition, data processing, and decision-making models. In this course, students will be able to develop advanced knowledge and skills to acquire related data for operations of business or projects; apply quantitative literacy skills such as statistics and machine learning; and use predictive or prescriptive modeling to make timely, actionable, and meaningful decisions.
Long Description: Data analytics is a rapidly evolving field. In today’s labour market, knowing how to acquire, process, and interpret large amounts of data to make optimal decisions is crucial for many professionals, especially those in business and engineering. This open textbook, “a new online course” if you will, focuses on three key concept areas: data acquisition, data processing, and decision-making models. In this course, students will be able to develop advanced knowledge and skills to acquire related data for operations of business or projects; apply quantitative literacy skills such as statistics and machine learning; and use predictive or prescriptive modeling to make timely, actionable, and meaningful decisions.
Word Count: 2038
(Note: This resource's metadata has been created automatically by reformatting and/or combining the information that the author initially provided as part of a bulk import process.)
Beta Version Word Count: 92165 ISBN: 979-8-88895-422-5 (Note: This resource's metadata has …
Beta Version
Word Count: 92165
ISBN: 979-8-88895-422-5
(Note: This resource's metadata has been created automatically by reformatting and/or combining the information that the author initially provided as part of a bulk import process.)
Data Carpentry's aim is to teach researchers basic concepts, skills, and tools …
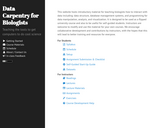
Data Carpentry's aim is to teach researchers basic concepts, skills, and tools for working more effectively with data. The lessons below were designed for those interested in working with Genomics data in R.
The Biology Semester-long Course was developed and piloted at the University of …
The Biology Semester-long Course was developed and piloted at the University of Florida in Fall 2015. Course materials include readings, lectures, exercises, and assignments that expand on the material presented at workshops focusing on SQL and R.
A part of the data workflow is preparing the data for analysis. …
A part of the data workflow is preparing the data for analysis. Some of this involves data cleaning, where errors in the data are identified and corrected or formatting made consistent. This step must be taken with the same care and attention to reproducibility as the analysis. OpenRefine (formerly Google Refine) is a powerful free and open source tool for working with messy data: cleaning it and transforming it from one format into another. This lesson will teach you to use OpenRefine to effectively clean and format data and automatically track any changes that you make. Many people comment that this tool saves them literally months of work trying to make these edits by hand.
6.263J / 16.37J focuses on the fundamentals of data communication networks. One …
6.263J / 16.37J focuses on the fundamentals of data communication networks. One goal is to give some insight into the rationale of why networks are structured the way they are today and to understand the issues facing the designers of next-generation data networks. Much of the course focuses on network algorithms and their performance. Students are expected to have a strong mathematical background and an understanding of probability theory. Topics discussed include: layered network architecture, Link Layer protocols, high-speed packet switching, queueing theory, Local Area Networks, and Wide Area Networking issues, including routing and flow control.
The A2DataDive assembled representatives from nonprofit organizations, U-M statistics and data sciences …
The A2DataDive assembled representatives from nonprofit organizations, U-M statistics and data sciences departments, and members of the community to collectively address the data analysis and visualization needs for area nonprofits and local organizations. Open.Michigan was one of the organizers of the A2DataDive, and worked with two School of Information graduate students to scope and implement the event. After identifying two organizations who had data needs:ŰÖFocus HopeŰÖand theŰÖAfrican Health OER Network, this joint community/university datadive took place over a weekend in February 2012 in North Quads space 2435, an adaptable space especially suited to collaborative, participatory work. The A2DataDive was a successful proof-of-concept for a joint collaboration between an academic institution and local organizations and businesses, and demonstrated that sharing skills and expertise to address a need is also a great way to help others.
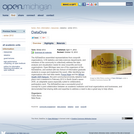
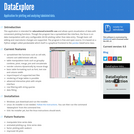
This is a desktop application for visualization of data with convenient plotting …
This is a desktop application for visualization of data with convenient plotting functions. It is intended for educational/scientific use and teaching data analysis skills such as aggregation, merging data and getting statistics. Though the program has a spreadsheet like interface, the focus is on data manipulation with very configurable 2D/3D plotting rather than data entry. Though basic cell editing and row/column changes are supported. The program is open source., licensed under the GPL. This program is suitable for use by secondary school and third level students wishing to learn about data manipulation and advanced plotting.
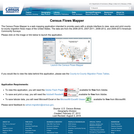
The Census Flows Mapper is a web mapping application intended to provide …
The Census Flows Mapper is a web mapping application intended to provide users with a simple interface to view, save and print county-to-county migration flows maps of the United States. The data are from the 2006-2010 American Community Survey.
A Claremont Graduate University EDUC 448 Fall 2021 Course Publication Short Description: …
A Claremont Graduate University EDUC 448 Fall 2021 Course Publication
Short Description: This glossary is intended to support professionals who are seeking to understand Data Management and Governance in the context of K-12 and higher education. The definitions included in this ebook provide a fundamental understanding of common Data Management and Governance terms. This glossary was co-created by education professionals and graduate students enrolled in Claremont Graduate University’s EDUC 448: Data Management & Governance course taught by Dr. Gwen Garrison, PhD during the Fall 2021 semester.
Word Count: 2578
(Note: This resource's metadata has been created automatically by reformatting and/or combining the information that the author initially provided as part of a bulk import process.)
Databases are useful for both storing and using data effectively. Using a …
Databases are useful for both storing and using data effectively. Using a relational database serves several purposes. It keeps your data separate from your analysis. This means there’s no risk of accidentally changing data when you analyze it. If we get new data we can rerun a query to find all the data that meets certain criteria. It’s fast, even for large amounts of data. It improves quality control of data entry (type constraints and use of forms in Access, Filemaker, etc.) The concepts of relational database querying are core to understanding how to do similar things using programming languages such as R or Python. This lesson will teach you what relational databases are, how you can load data into them and how you can query databases to extract just the information that you need.
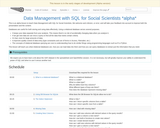
This is an alpha lesson to teach Data Management with SQL for …
This is an alpha lesson to teach Data Management with SQL for Social Scientists, We welcome and criticism, or error; and will take your feedback into account to improve both the presentation and the content. Databases are useful for both storing and using data effectively. Using a relational database serves several purposes. It keeps your data separate from your analysis. This means there’s no risk of accidentally changing data when you analyze it. If we get new data we can rerun a query to find all the data that meets certain criteria. It’s fast, even for large amounts of data. It improves quality control of data entry (type constraints and use of forms in Access, Filemaker, etc.) The concepts of relational database querying are core to understanding how to do similar things using programming languages such as R or Python. This lesson will teach you what relational databases are, how you can load data into them and how you can query databases to extract just the information that you need.
Network analysis is one of the four pillars of computational humanities, along …
Network analysis is one of the four pillars of computational humanities, along with geographic, text, and image analysis. Participants in this course will receive a broad overview of networks as they’re applied to humanities problems.
Data that has relevance for managerial decisions is accumulating at an incredible …
Data that has relevance for managerial decisions is accumulating at an incredible rate due to a host of technological advances. Electronic data capture has become inexpensive and ubiquitous as a by-product of innovations such as the internet, e-commerce, electronic banking, point-of-sale devices, bar-code readers, and intelligent machines. Such data is often stored in data warehouses and data marts specifically intended for management decision support. Data mining is a rapidly growing field that is concerned with developing techniques to assist managers to make intelligent use of these repositories. A number of successful applications have been reported in areas such as credit rating, fraud detection, database marketing, customer relationship management, and stock market investments. The field of data mining has evolved from the disciplines of statistics and artificial intelligence. This course will examine methods that have emerged from both fields and proven to be of value in recognizing patterns and making predictions from an applications perspective. We will survey applications and provide an opportunity for hands-on experimentation with algorithms for data mining using easy-to-use software and cases.
This course is designed to introduce first-year Sloan MBA students to the …
This course is designed to introduce first-year Sloan MBA students to the fundamental techniques of using data. In particular, the course focuses on various ways of modeling, or thinking structurally about decision problems in order to make informed management decisions.
Good data organization is the foundation of any research project. Most researchers …
Good data organization is the foundation of any research project. Most researchers have data in spreadsheets, so it’s the place that many research projects start. We organize data in spreadsheets in the ways that we as humans want to work with the data, but computers require that data be organized in particular ways. In order to use tools that make computation more efficient, such as programming languages like R or Python, we need to structure our data the way that computers need the data. Since this is where most research projects start, this is where we want to start too! In this lesson, you will learn: Good data entry practices - formatting data tables in spreadsheets How to avoid common formatting mistakes Approaches for handling dates in spreadsheets Basic quality control and data manipulation in spreadsheets Exporting data from spreadsheets In this lesson, however, you will not learn about data analysis with spreadsheets. Much of your time as a researcher will be spent in the initial ‘data wrangling’ stage, where you need to organize the data to perform a proper analysis later. It’s not the most fun, but it is necessary. In this lesson you will learn how to think about data organization and some practices for more effective data wrangling. With this approach you can better format current data and plan new data collection so less data wrangling is needed.
No restrictions on your remixing, redistributing, or making derivative works. Give credit to the author, as required.
Your remixing, redistributing, or making derivatives works comes with some restrictions, including how it is shared.
Your redistributing comes with some restrictions. Do not remix or make derivative works.
Most restrictive license type. Prohibits most uses, sharing, and any changes.
Copyrighted materials, available under Fair Use and the TEACH Act for US-based educators, or other custom arrangements. Go to the resource provider to see their individual restrictions.