In this lesson, students will explain CRaTER's purpose and how it works. …
In this lesson, students will explain CRaTER's purpose and how it works. They will also design (using paper and pencil) a cosmic ray detector to answer their own questions. CRaTER's purpose is to identify safe landing sites for future human missions to the moon; discover potential resources on the Moon; and characterize the radiation environment of the Moon. The lesson includes background information for the teacher, questions, and information about student preconceptions. This is lesson 4 of 4 from "The Cosmic Ray Telescope for the Effects of Radiation."
This is an activity about impact craters. Learners will experiment to create …
This is an activity about impact craters. Learners will experiment to create impact craters and examine the associated features. Then they observe images of lunar craters and explore how the mass, shape, velocity, and angle of impactors affects the size and shape of the crater. This activity is part of Explore! To the Moon and Beyond! - a resource developed specifically for use in libraries.
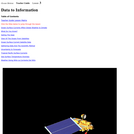
In this example, students learn how to read a topographic map and …
In this example, students learn how to read a topographic map and understand map contours. This resource is from PUMAS - Practical Uses of Math and Science - a collection of brief examples created by scientists and engineers showing how math and science topics taught in K-12 classes have real world applications.
DASHlink is a virtual laboratory for scientists and engineers to disseminate results …
DASHlink is a virtual laboratory for scientists and engineers to disseminate results and collaborate on research problems in health management technologies for aeronautics systems. Managed by the Integrated Vehicle Health Management project within NASA's Aviation Safety program, the Web site is designed to be a resource for anyone interested in data mining, IVHM, aeronautics and NASA.
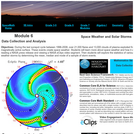
During the last sunspot cycle between 1996-2008, over 21,000 flares and 13,000 …
During the last sunspot cycle between 1996-2008, over 21,000 flares and 13,000 clouds of plasma exploded from the Sun's magnetically active surface. These events create space weather. Students will learn more about space weather and how it affects Earth through reading a NASA press release and viewing a NASA eClips video segment. Then students will explore the statistics of various types of space weather storms by determining the mean, median and mode of a sample of storm events. This activity is part of the Space Math multimedia modules that integrate NASA press releases, NASA archival video, and mathematics problems targeted at specific math standards commonly encountered in middle school textbooks. The modules cover specific math topics at multiple levels of difficulty with real-world data and use the 5E instructional sequence.
This lesson incorporates sea surface data collected by NASA satellites. Data for …
This lesson incorporates sea surface data collected by NASA satellites. Data for three surface characteristics- height, temperature and speed- are used for several activities. Students examine the differences in speed of currents relative to distance from the Equator. Sea surface data anomalies are charted and further analyzed. In addition, surface current data is presented to examine patterns related to El Niño. Note that this is lesson three of five on the Ocean Motion website. Each lesson investigates ocean surface circulation using satellite and model data and can be done independently. See Related URL's for links to the Ocean Motion Website that provide science background information, data resources, teacher material, student guides and a lesson matrix.
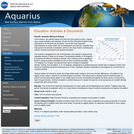
These two hands-on labs are about the role of temperature and salinity …
These two hands-on labs are about the role of temperature and salinity in governing the density of seawater, a major factor controlling the ocean's vertical movements and layered circulation. In the first activity students work in groups to determine the density of tap water and of tap water with salt, then compare the densities. The second activity investigates the role of temperature and salinity in determining seawater density. Students use a Temperature-Salinity (T-S) Diagram to examine the effect of mixing on density. A list of key concepts, essential questions, common preconceptions and more is included. These are part of the Aquarius Hands-on Laboratory Activities.
Learners will build an open spectrograph to calculate the angle the light …
Learners will build an open spectrograph to calculate the angle the light is transmitted through a holographic diffraction grating. After finding the desired angles, the students will design their own spectrograph using the information learned. The activity is part of Project Spectra, a science and engineering program for middle-high school students, focusing on how light is used to explore the Solar System.
In this problem-based learning (PBL) activity, students take on the role of …
In this problem-based learning (PBL) activity, students take on the role of a student research scientist and explore the role of solar energy in determining climate, focusing on the urban heat island effect. Students conduct research and compare temperatures between two cities, and determine the factors that are responsible for the difference exhibited between them. The lesson is supported by teacher notes, answer key, glossary and an appendix with information about using PBL in the classroom. This is the third of three activities in Investigating the Climate System: Energy, a Balancing Act, and serves as an authentic assessment for all three modules.
This is an activity about creating impacts on sandy surfaces. Learners will …
This is an activity about creating impacts on sandy surfaces. Learners will use trays of sand and a variety of solid objects to model the effects of "impactors" on the surface. This is activity 6 of 9 in Mars and Earth: Science Learning Activities for After School.
Learners will use trays of sand and cups of water to recreate …
Learners will use trays of sand and cups of water to recreate surface features seen in images of Mars. This is activity 5 of 9 in Mars and Earth: Science Learning Activities for After School.
This is an activity about modeling the effect of wind on a …
This is an activity about modeling the effect of wind on a sandy surface. Learners will use trays of sand and straws to recreate surface features of images of Mars. Participants test their ideas about how some of the features on Mars might have been produced. This is activity 4 of 9 in Mars and Earth: Science Learning Activities for After School.
In this lesson, students will learn how cosmic rays were discovered and …
In this lesson, students will learn how cosmic rays were discovered and what they are - including their size and speed. Includes background information for the teacher, questions, activities and information about student preconceptions. This is lesson 1 of 4 from "The Cosmic Ray Telescope for the Effects of Radiation (CRaTER)."
This is an activity about the Hubble Deep Field image, an observation …
This is an activity about the Hubble Deep Field image, an observation of one small area of sky that contained no previously-detected objects. The long time exposure of this image allows us to detect some of the most distant objects seen in our Universe. Learners will view an image of the Hubble Deep Field and identify how many distant galaxies are visible as well as the types of galaxies they might be. Observations will be taken a step further to infer predominant age of a galaxy and determine if there are any trends in age (color) versus galaxy size or type and, ultimately, if the distant Universe appears relatively uniform. This activity is Astronomy Activity 4 in a larger resource, titled "Space Update."
This is an online lesson which introduces the concept of astronomical filters …
This is an online lesson which introduces the concept of astronomical filters and their connections to imaging different objects in space. Learners will explore perceptions of images as seen using different colors of light, construct a filter wheel, and practice investigating various astronomical images using the filter wheel. This material was designed to highlight how filters are useful to astronomers and show how a real astronomical telescope uses filters to image the Sun.
In this activity, students monitor the change that takes place when water …
In this activity, students monitor the change that takes place when water vapor condenses from a gas to a liquid and see how a change in temperature affects this transformation. Materials needed to conduct the investigation include two thermometers, a clear glass container, ice cubes and tap water. The resource includes background information, teaching tips and questions to guide student discussion. This is chapter 10 of Meteorology: An Educator's Resource for Inquiry-Based Learning for Grades 5-9. The guide includes a discussion of learning science, the use of inquiry in the classroom, instructions for making simple weather instruments, and more than 20 weather investigations ranging from teacher-centered to guided and open inquiry investigations.
No restrictions on your remixing, redistributing, or making derivative works. Give credit to the author, as required.
Your remixing, redistributing, or making derivatives works comes with some restrictions, including how it is shared.
Your redistributing comes with some restrictions. Do not remix or make derivative works.
Most restrictive license type. Prohibits most uses, sharing, and any changes.
Copyrighted materials, available under Fair Use and the TEACH Act for US-based educators, or other custom arrangements. Go to the resource provider to see their individual restrictions.