Is your understanding of Cloud GIS a bit hazy? Does thinking about …
Is your understanding of Cloud GIS a bit hazy? Does thinking about it leave you in a fog? We've designed GEOG 865, Cloud and Server GIS, to help you understand how all of the various pieces of architecture fit together. By the end of the class you'll have a clear understanding of esri's and others' offerings in the space, how to implement ArcGIS Enterprise on Amazon EC2, make online maps with Carto and Mapbox, and engage in some blue sky thinking of your own in our weekly discussions about trends and directions.
Has your attention recently been caught by news of coastal catastrophes such …
Has your attention recently been caught by news of coastal catastrophes such as hurricanes and tsunamis? Do you wonder why so many coastal communities in the world are vulnerable to flooding and other coastal hazards? Have you considered what coastal flood protections cities like Houston and Miami will need in the future to protect their residents? This course will provide a better understanding of these phenomena. We present a global perspective of coastal landscapes, the geologic processes responsible for their formation, and ways that society responds to hazards like sea level rise and catastrophic weather events. You will participate in active learning exercises such as analyzing real-world datasets and applying critical thinking to real-world societal problems while investigating a coastal community.
Prior to this lab exercise, students discuss general physical differences between the …
Prior to this lab exercise, students discuss general physical differences between the planets Earth, Moon and Mars, and why these physical differences exist. They use globes and global data sets in lecture to investigate large-scale patters, similarities and differences between these bodies. They discuss methods by which planetary geologists study the surfaces of other planets. While working on this laboratory exercise, they use maps of the Earth, Moon and Mars (both geologic and topographic) as well as data from missions such as Clementine, MOLA, and HRSC, which they obtain online. The investigate impact crater morphology between the Earth and Moon; comparative planetary geology in the form of fluvial, tectonic, and volcanologic comparisons of Earth and Mars; and complete a geologic map and history of a region of Mars using only orbital images and data sets.
(Note: this resource was added to OER Commons as part of a batch upload of over 2,200 records. If you notice an issue with the quality of the metadata, please let us know by using the 'report' button and we will flag it for consideration.)
To address the cost of resources for exercise manuals in GIS, I …
To address the cost of resources for exercise manuals in GIS, I have developed a series of class exercises that can be used with QGIS, a free and open source software. In addition, some class activities address more general ideas associated with cartography, such as color theory. To make these resources fully accessible to students, I have recorded publicly available videos documenting how these class activities can be completed. There is one video for each classroom lesson in this course offering, and links to all of the videos on the website Vimeo are linked to.
DESCRIPTION Develops skills needed to produce maps using ArcGIS Desktop software. Outlines cartographic principles and map use. Emphasis on mapping techniques within a GIS. Intended for students enrolled in GIS or UAS programs.
LEARNING OUTCOMES 1. Demonstrate knowledge and apply skills essential to the discipline. 2. Coordinate and manage the delivery of reliable, valid, GIS data including analysis and specialized user needs products. 3. Communicate effectively and appropriately within a professional setting in both written and oral form. 4. Utilize professional communication skills to achieve project outcomes in collaboration with GIS users across disciplines. 5. Research, interpret and apply data/information in the professional setting. 6. Develop and implement GIS services for users who may or may not be GIS knowledgeable.
This activity proposes different small experiments and discussions to show that in …
This activity proposes different small experiments and discussions to show that in the summer it is cooler by the sea than on the land and that water cools off more slowly than soil.
In this activity, students construct three-dimensional models from terrain information provided by …
In this activity, students construct three-dimensional models from terrain information provided by two-dimensional topographic maps. This will allow them to visualize how changes in elevation over a certain distance can be represented on a flat piece of paper that can be folded up and tucked away. Each group is responsible for constructing a model of Mount St. Helens 'before' and 'after', a depression, a stream, and a hill. Discussion questions related to the different representations are also included.
This Earth Exploration Toolbook chapter is a detailed computer-based exploration in which …
This Earth Exploration Toolbook chapter is a detailed computer-based exploration in which students learn how various climatic conditions impact the formations of sediment layers on the ocean floor. They analyze sediment core data from the Ross Ice Shelf in Antarctica for evidence of climate changes over time. In addition, they interact with various tools and animations throughout the activity, in particular the Paleontological Stratigraphic Interval Construction and Analysis Tool (PSICAT) that is used to construct a climate change model of a sediment core from core images.
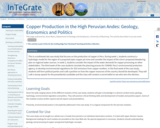
This is a multi-component case study on copper and Peru. It attemps …
This is a multi-component case study on copper and Peru. It attemps to look at a specific mineral resource through multiple lenses, e.g. geology, economics, regulation and political process.
Students learn about local and planetary physical geography / geology, toponymy, planetary …
Students learn about local and planetary physical geography / geology, toponymy, planetary landing site selection and cartography. The students learn a complex process of landscape evaluation and city planning, based on the interpretation of photomaps or digital terrain models.
This 10 minute video builds connections between topics that are important in …
This 10 minute video builds connections between topics that are important in climate science such as: the impact of variations in Earth's orbit and wobble on it's axis on climate; how the cores being sampled fit into the bigger climate picture; connecting greenhouse gases to melting ice and sea level changes; the sensitivity of the ice melt / sea level rise relationship; and computer model simulations showing connections between ice sheets and sea level. The companion website provides resources, an extensive list of activities, teacher guides, posters, and more.
Describe different sociological models for understanding global stratificationUnderstand how studies of global …
Describe different sociological models for understanding global stratificationUnderstand how studies of global stratification identify worldwide inequalities
This lesson provides experience working on a real-life scenario by allowing students …
This lesson provides experience working on a real-life scenario by allowing students the opportunity to use topographic maps to design a hiking trail system based on access from road, range of habitats, and other specified criteria. They will also complete a data sheet and produce an informational brochure.
In this Physical Geography Lab, students are responsible for designing a simple …
In this Physical Geography Lab, students are responsible for designing a simple biological community.
(Note: this resource was added to OER Commons as part of a batch upload of over 2,200 records. If you notice an issue with the quality of the metadata, please let us know by using the 'report' button and we will flag it for consideration.)
The lesson content focuses on designing investigations concerning the notion of scale …
The lesson content focuses on designing investigations concerning the notion of scale through a series of investigations on their campus. The overarching goal is to foster a connection to the earth through an investigation of the local environment.
Some of the Viking images sent back from Mars in the 1970s …
Some of the Viking images sent back from Mars in the 1970s show tantalizing evidence of dendritic valley networks in some of the oldest terrains on the planet. One of the big questions ever since has been whether it might have rained early in Mars history.
One of the ways of deciding whether the Mars valley networks might have been produced by rainfall is to find out how similar they are to valley networks on Earth, which we know are produced by rainfall. The standard method for analyzing drainage basins is comparison of the number of drainage segments per square kilometer (drainage density) and how extensively branched the network is (stream order).
In this exercise, students calculate stream order for valley segments mapped by Hynek and Phillips (2003) using MOC/MOLA data. Students then use data on valley segment length and drainage basin area from Hynek and Phillips (2003) to calculate drainage density. They compare stream order and drainage density for the Mars site with similar calculations for areas on Earth and evaluate the question of whether valley networks on Mars might be consistent with rainfall on an early Mars, and what the uncertainties and limitations are in their conclusions.
(Note: this resource was added to OER Commons as part of a batch upload of over 2,200 records. If you notice an issue with the quality of the metadata, please let us know by using the 'report' button and we will flag it for consideration.)
No restrictions on your remixing, redistributing, or making derivative works. Give credit to the author, as required.
Your remixing, redistributing, or making derivatives works comes with some restrictions, including how it is shared.
Your redistributing comes with some restrictions. Do not remix or make derivative works.
Most restrictive license type. Prohibits most uses, sharing, and any changes.
Copyrighted materials, available under Fair Use and the TEACH Act for US-based educators, or other custom arrangements. Go to the resource provider to see their individual restrictions.