Presentations, materials and other resources offered throughout the 2019 Continuous Quality Improvement …
Presentations, materials and other resources offered throughout the 2019 Continuous Quality Improvement Statewide Conference for Child Welfare and Probation at UC Davis.
This is an introduction to the classic version of ArcGIS StoryMaps. It …
This is an introduction to the classic version of ArcGIS StoryMaps. It provides a walkthrough of the website functions and has tasks listed for students to build their first story map.
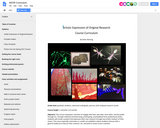
Grade level: graduate students, advanced undergrads, persons with analyzed research results Course …
Grade level: graduate students, advanced undergrads, persons with analyzed research results
Course length: 1 semester, 4-6 months
Objective: This course empowers scientists to engage with their own data, each other, and the public through art. Through collective brainstorming, prototyping, and feedback from professional artists, students will create a project that expresses their own research through any artistic medium of their choice. The course typically culminates in a public art exhibition where students interact with a general audience to discuss their research, art, and what it means to be a scientist.
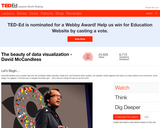
David McCandless turns complex data sets (like worldwide military spending, media buzz, …
David McCandless turns complex data sets (like worldwide military spending, media buzz, Facebook status updates) into beautiful, simple diagrams that tease out unseen patterns and connections. Good design, he suggests, is the best way to navigate information glut -- and it may just change the way we see the world. A quiz, thought provoking question, and links for further study are provided to create a lesson around the 18-minute video. Educators may use the platform to easily "Flip" or create their own lesson for use with their students of any age or level.
The aim of this course is to provide fundamental statistical concepts and …
The aim of this course is to provide fundamental statistical concepts and tools relevant to the practice of summarizing, analyzing, and visualizing data. This course will build your knowledge of the fundamental principles of biostatistical inference. The course will focus on linear regression and generalized linear regression models. We will use a variety of examples and exercises from scientific, medical, and public health research.
Submitted as part of the California Learning Resource Network (CLRN) Phase 3 …
Submitted as part of the California Learning Resource Network (CLRN) Phase 3 Digital Textbook Initiative (CA DTI3), CK-12 Advanced Probability and Statistics introduces students to basic topics in statistics and probability but finishes with the rigorous topics an advanced placement course requires. Includes visualizations of data, introduction to probability, discrete probability distribution, normal distribution, planning and conducting a study, sampling distributions, hypothesis testing, regression and correlation, Chi-Square, analysis of variance, and non-parametric statistics.
As if they are environmental engineers, student pairs are challenged to use …
As if they are environmental engineers, student pairs are challenged to use Google Earth Pro (free) GIS software to view and examine past data on hurricanes and tornados in order to (hypothetically) advise their state government on how to proceed with its next-year budget—to answer the question: should we reduce funding for natural disaster relief? To do this, students learn about maps, geographic information systems (GIS) and the global positioning system (GPS), and how they are used to deepen the way maps are used to examine and analyze data. Then they put their knowledge to work by using the GIS software to explore historical severe storm (tornado, hurricane) data in depth. Student pairs confer with other teams, conduct Internet research on specific storms and conclude by presenting their recommendations to the class. Students gain practice and perspective on making evidence-based decisions. A slide presentation as well as a student worksheet with instructions and questions are provided.
This course explores visualization methodologies to conceive and represent systems and data, …
This course explores visualization methodologies to conceive and represent systems and data, e.g., financial, media, economic, political, etc., with a particular focus on climate change data in this version of the course. Topics include basic methods for research, cleaning, and analysis of datasets, and creative methods of data presentation and storytelling. The course considers the emotional, aesthetic, ethical, and practical effects of different presentation methods as well as how to develop metrics for assessing impact. Coursework includes readings, visualization exercises, and a final project.
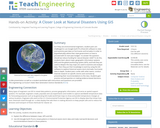
The home of the U.S. Government’s open data. Here you will find …
The home of the U.S. Government’s open data. Here you will find data, tools, and resources to conduct research, develop web and mobile applications, design data visualizations, and more. Topics include Agriculture, Business, Climate, Education, Energy, Ecosystems, Manufacturing and more.
This course examines the theory and practice of using computational methods in …
This course examines the theory and practice of using computational methods in the emerging field of digital humanities. It develops an understanding of key digital humanities concepts, such as data representation, digital archives, information visualization, and user interaction through the study of contemporary research, in conjunction with working on real-world projects for scholarly, educational, and public needs. Students create prototypes, write design papers, and conduct user studies.
These are slides for a masters-level course with the following course description:An …
These are slides for a masters-level course with the following course description:An intensive course in which students will create sophisticated work in multiple modalities (e.g. text, images, audio, etc.) that develops and expresses ideas focused on the needs of the audience to increase its knowledge, foster understanding, or promote a change in its attitudes.The audience for this course was primarily working professionals with a wide range of prior knowledge of these practices, so this material could easily be (and was) adapted for undergraduate students. I think it would also be possible to adapt for high schoolers, if desired.
Essentials of Geographic Information Systems integrates key concepts behind the technology with …
Essentials of Geographic Information Systems integrates key concepts behind the technology with practical concerns and real-world applications. Recognizing that many potential GIS users are nonspecialists or may only need a few maps, this book is designed to be accessible, pragmatic, and concise. Essentials of Geographic Information Systems also illustrates how GIS is used to ask questions, inform choices, and guide policy. From the melting of the polar ice caps to privacy issues associated with mapping, this book provides a gentle, yet substantive, introduction to the use and application of digital maps, mapping, and GIS.
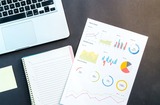
This applied webinar explores best practices for communicating open educational data with …
This applied webinar explores best practices for communicating open educational data with a wide audience. Topics include different methods for encoding data, the use of color and considerations for color blindness, visual perception, common pitfalls, and methods for minimizing cognitive load. Dr. Daniel Anderson, from the University of Oregon, guides the audience through these topics, while also briefly discussing mediums for communication, including data dashboards to reach a larger and more diverse audience.
Tell your story and show it with data, using free and easy-to-learn …
Tell your story and show it with data, using free and easy-to-learn tools on the web. This introductory book teaches you how to design interactive charts and customized maps for your website, beginning with easy drag-and-drop tools, such as Google Sheets, Datawrapper, and Tableau Public. You’ll also gradually learn how to edit open-source code templates built with Chart.js, Highcharts, and Leaflet on GitHub.
Hands-On Data Visualization takes you step-by-step through tutorials, real-world examples, and online resources. This book is ideal for students, educators, community activists, non-profit organizations, small business owners, local governments, journalists, researchers, or anyone who wants to take data out of spreadsheets and turn it into lively interactive stories. No coding experience is required.
Learn more about this open-access web edition, based on the book manuscript we submitted to our publisher, O’Reilly Media, Inc., which we have permission to freely share under the terms of our contract. Readers may purchase the publisher’s improved and copyedited version, in print or ebook editions. Figure numbering and other details vary between this open-access web edition and the publisher’s editions.
How to do science: a guide to researching human physiology has been …
How to do science: a guide to researching human physiology has been written for students of the life sciences who are actively engaged in the scientific process. A lot of support is available for students learning scientific facts, but we found that it was harder to find resources to support students to become scientists.
This ebook introduces you to what it means to be a scientist. You will learn about the scientific method and how to do many tasks of a scientist, your roles and responsibilities as a scientist as well as possible career paths, and how to use your skills as a science graduate to get a leg up in the job market.
Information visualization is concerned with the visual and interactive representation of abstract …
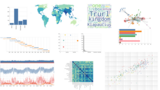
Information visualization is concerned with the visual and interactive representation of abstract and possibly complex datasets. As we encounter growing datasets in various sectors there is an increasing need to develop effective methods for making sense of data. Information visualization relies on computational means and our perceptual system to help reveal otherwise invisible patterns and gain new insights. Across various fields, there is great hope in the power of visualization to turn complex data into informative, engaging, and maybe even attractive forms. However, it typically takes several steps of data preparation and processing before a given dataset can be meaningfully visualized. While visualizations can indeed provide novel and useful perspectives on data, they can also obscure or misrepresent certain aspects of a phenomenon. Thus it is essential to develop a critical literacy towards the rhetoric of information visualization. One of the best ways to develop this literacy is to learn how to create visualizations! The tutorials offer a practical approach to working with data and to create interactive visualizations.
The tutorials require basic familiarity with statistics and programming. They come as Jupyter notebooks containing both human-readable explanations as well as computable code. The code blocks in the tutorials are written in Python, which you should either have already some experience with or a keen curiosity for. The tutorials make frequent use of the data analysis library Pandas, the visualization library Altair, and a range of other packages. You can view the tutorials as webpages, open and run them on Google Colab, or download the Jupyter notebook files to edit and run them locally.
Geographic Information System (GIS) software manages data that represent the location of …
Geographic Information System (GIS) software manages data that represent the location of features (geographic coordinate data) and what they are like (attribute data); it also provides the ability to query, manipulate, and analyze those data. Because GIS allows one to represent social and environmental data on maps, it is a powerful tool for analysis and planning in various fields. This course is meant to introduce students to the basic capabilities of GIS.
This is an open-source and open access book on how to do …
This is an open-source and open access book on how to do Data Science using Julia. The book describes the basics of the Julia programming language DataFrames.jl for data manipulation and Makie.jl for data visualization.
You will learn to:
- Read CSV and Excel data into Julia - Process data in Julia, that is, learn how to answer data questions - Filter and subset data - Handle missing data - Join multiple data sources together - Group and summarize data - Export data out of Julia to CSV and Excel files - Plot data with different Makie.jl backends - Save visualizations in several formats such as PNG or PDF - Use different plotting functions to make diverse data visualizations - Customize visualizations with attributes - Use and create new plotting themes - Add LaTeX elements to plots - Manipulate color and palettes - Create complex figure layouts
This curriculum was designed for high school students with no prior coding …
This curriculum was designed for high school students with no prior coding experience who are interested in learning Python programming for data science. However, this course material would be useful for anyone interested in teaching or learning basic programming for data analysis.
The curriculum features short lessons to deliver course material in “bite sized” chunks, followed by practices to solidify the learners' understanding. Pre-recorded videos of lessons enable effective virtual learning and flipped classroom approaches.
The learning objectives of this curriculum are:
1. Write code in Python with correct syntax and following best practices. 2. Implement fundamental programming concepts when presented with a programmatic problem set. 3. Apply data analysis to real world data to answer scientific questions. 4. Create informative summary statistics and data visualizations in Python. 5. These skills provide a solid foundation for basic data analysis in Python. Participation in our program exposes students to the many ways coding and data science can be impactful across many disciplines.
Our curriculum design consists of 27 lessons broken up into 5 modules that cover Jupyter notebook setup, Python coding fundamentals, use of essential data science packages including pandas and numpy, basic statistical analyses, and plotting using seaborn and matplotlib. Each lesson consists of a lesson notebook, used for teaching the concept via live coding, and a practice notebook containing similar exercises for the student to complete on their own following the lesson. Each lesson builds on those before it, beginning with relevant content reminders from the previous lessons and ending with a concise summary of the skills presented within.
No restrictions on your remixing, redistributing, or making derivative works. Give credit to the author, as required.
Your remixing, redistributing, or making derivatives works comes with some restrictions, including how it is shared.
Your redistributing comes with some restrictions. Do not remix or make derivative works.
Most restrictive license type. Prohibits most uses, sharing, and any changes.
Copyrighted materials, available under Fair Use and the TEACH Act for US-based educators, or other custom arrangements. Go to the resource provider to see their individual restrictions.