Updating search results...

Search Resources

26 Results

View
Selected filters:
  • data-visualization
Models of the Hydrogen Atom
Unrestricted Use
CC BY
Rating
0.0 stars

How did scientists figure out the structure of atoms without looking at them? Try out different models by shooting light at the atom. Check how the prediction of the model matches the experimental results.

Subject:
Physical Science
Physics
Material Type:
Simulation
Provider:
University of Colorado Boulder
Provider Set:
PhET Interactive Simulations
Author:
Carl Wieman
Chris Malley
Kathy Perkins
Michael Dubson
Mindy Gratny
Sam McKagan
Wendy Adams
Date Added:
01/01/2007
Old Weather: Our Weather's Past, The Climate's Future
Only Sharing Permitted
CC BY-NC-ND
Rating
0.0 stars

Help scientists recover worldwide weather observations made by Royal Navy ships around the time of World War I. These transcriptions will contribute to climate model projections and improve a database of weather extremes. Historians will use your work to track past ship movements and the stories of the people on board.

Subject:
Atmospheric Science
Physical Science
Material Type:
Interactive
Provider:
Citizen Science Alliance
Provider Set:
Zooniverse
Date Added:
04/23/2012
Our World in Data
Unrestricted Use
CC BY
Rating
0.0 stars

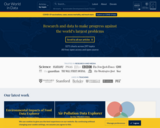
The research publications on Our World in Data are dedicated to a large range of global problems in health, education, violence, political power, human rights, war, poverty, inequality, energy, hunger, and humanity’s impact on the environment. On the homepage we list all the global problems and important long-term changes that we have researched.

Thanks to the work of thousands of researchers around the world who dedicate their lives to it, we often have a good understanding of how it is possible to make progress against the large problems we are facing. The world has the resources to do much better and reduce the suffering in the world.

We believe that a key reason why we fail to achieve the progress we are capable of is that we do not make enough use of this existing research and data: the important knowledge is often stored in inaccessible databases, locked away behind paywalls and buried under jargon in academic papers.

The goal of our work is to make the knowledge on the big problems accessible and understandable. As we say on our homepage, Our World in Data’s mission is to publish the “research and data to make progress against the world’s largest problems”.

Licenses: All visualizations, data, and articles produced by Our World in Data are open access under the Creative Commons BY license. You have permission to use, distribute, and reproduce these in any medium, provided the source and authors are credited. All the software and code that we write is open source and made available via GitHub under the permissive MIT license. All other material, including data produced by third parties and made available by Our World in Data, is subject to the license terms from the original third-party authors.

Subject:
Applied Science
Material Type:
Diagram/Illustration
Author:
Bastian Herre
Edouard Mathieu
Hannah Ritchie
Max Roser
Lucas Rod S-guirao Marcel Gerber
Date Added:
08/23/2022
Probability & Statistics - Basic Short Course (Student's Edition)
Conditional Remix & Share Permitted
CC BY-NC-SA
Rating
0.0 stars

CK-12 Foundation's Basic Probability and Statistics - A Short Course is an introduction to theoretical probability and data organization. Students learn about events, conditions, random variables, and graphs and tables that allow them to manage data.

Subject:
Mathematics
Statistics and Probability
Material Type:
Textbook
Provider:
CK-12 Foundation
Provider Set:
CK-12 FlexBook
Author:
Meery, Brenda (Editor)
Date Added:
12/12/2010
Real-World Applications for Analytics Teaching and Learning
Conditional Remix & Share Permitted
CC BY-NC-SA
Rating
0.0 stars

This document provides learning-by-doing materials for Analytics software skill development using SAS JMP. It integrates Analytics concepts and techniques with real-world scenarios based on the COVID-19 pandemic to illustrate how real-world data can be transformed into actionable insights to offer decision support for COVID-19 related issues. A holistic treatment of the Analytics process from data acquisition and cleansing to data analysis and interpretation is emphasized using five studies:
Characterize COVID-19 mortality demographic risk factors,
Visualize COVID-19 mortality demographics,
Conduct COVID-19 mortality time series forecasting,
Predict COVID-19 mortality, and
Analyze COVID-19 vaccine acceptance, uptake, and experiences.

Each study is structured with guiding questions to engage students to think critically, relate Analytic concepts to the given situation, and arrive at their own answers/solutions for active knowledge exploration and discovery.

Subject:
Mathematics
Measurement and Data
Material Type:
Homework/Assignment
Provider:
University of Kentucky
Author:
Anita Lee-Post
Date Added:
12/08/2021
Visualization for Mathematics, Science, and Technology Education
Conditional Remix & Share Permitted
CC BY-NC-SA
Rating
0.0 stars

This course is an introduction to principles and techniques of visual communication, and provides opportunities for science and engineering majors to acquire practical skills in the visual computer arts, in a studio environment. Students will learn how to create graphics for print and web, animations, and interactive media, and how to use these techniques to effectively communicate scientific and engineering concepts for learning and teaching. This class involves three hands-on creative projects, which will be presented in class.

Subject:
Arts and Humanities
Business and Communication
Career and Technical Education
Communication
Education
Educational Technology
Film and Music Production
Graphic Arts
Graphic Design
Social Science
Visual Arts
Material Type:
Full Course
Provider:
MIT
Provider Set:
MIT OpenCourseWare
Author:
Ivanova, Violeta
Date Added:
02/01/2016