Food for Thought
Unit Plan
Unit Summary
Students analyze their own nutrition and then complete a project where they develop a research question, collect data in the field about students' nutrition, and analyze their data. Students use their research on nutritional requirements and student data to recommend changes in the school to improve student nutrition. Student teams identify and summarize their persuasive arguments with the data they have gathered. They present their findings to the appropriate audience with decision-making authority.
At a Glance
Grade Level: 6-8
Subjects: Science, Mathematics, Health
Topics: Nutrition, Health, Consumer Awareness, Persuasion, Business
Higher-Order Thinking Skills: Critical Analysis, Interpretation of Data
Key Learnings: Importance of Diet, Persuasive Writing, Planning Healthy Meals, Interpreting Food Labels
Time Needed: 3-4 weeks, depending on the amount of out-of-class work
Things You Need
Unit Assessment Plan (Appendix A)
Unit Standards (Appendix B)
Unit Materials and Resources (Appendix C)
Mobile Learning
Mobile apps, reviewed by professional educators for related instructional content.
Android
iOS
Windows 8
Common Core Alignment
This unit is aligned to Common Core State Standards for Math.
Math: 5.MD Measurement and Data, 7.SP Statistics and Probability
This unit is aligned to Next Generation Science Standards.
MMS-ESS3 Earth and Human Activity
Curriculum-Framing Questions
Essential Question
How can I stay healthy?Unit Questions
How healthy are our school's students?
How can we plan and follow a healthy, nutritious, and appetizing diet?Content Questions
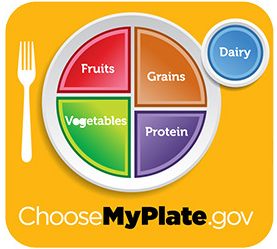
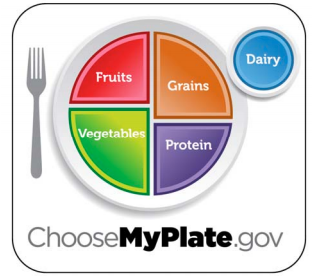
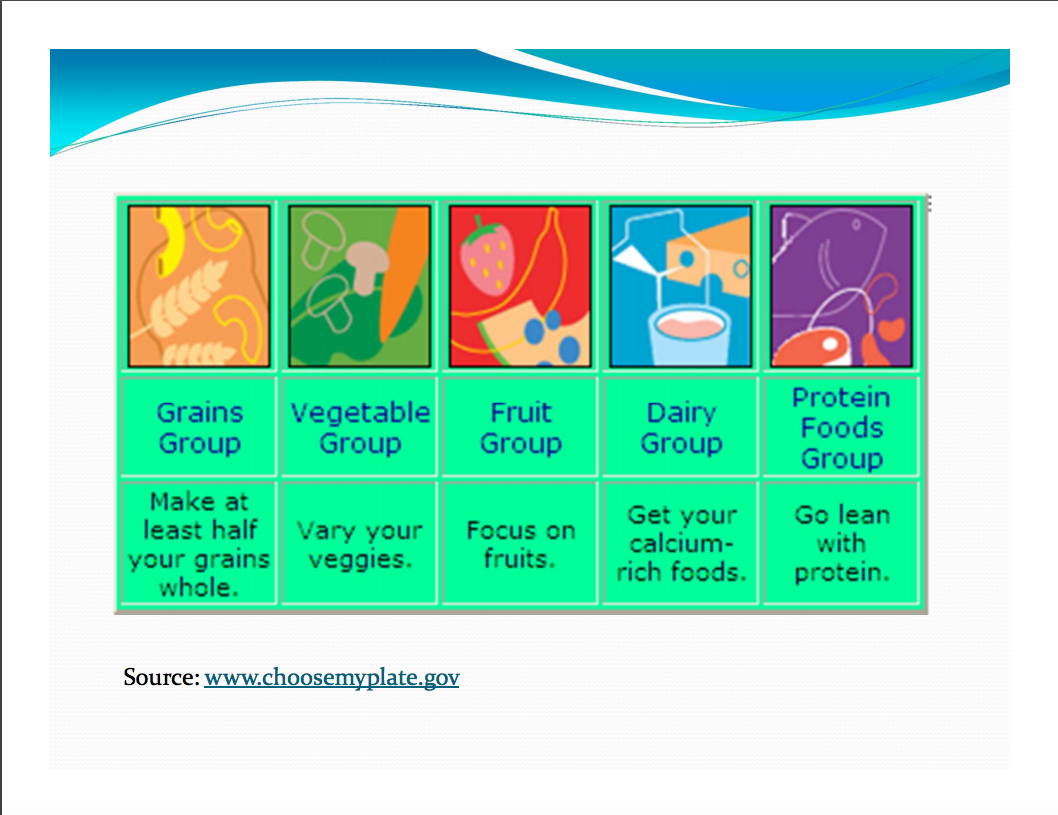
What is the food pyramid?
How do I determine calories burned?
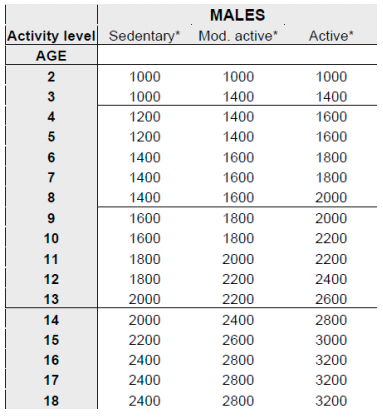
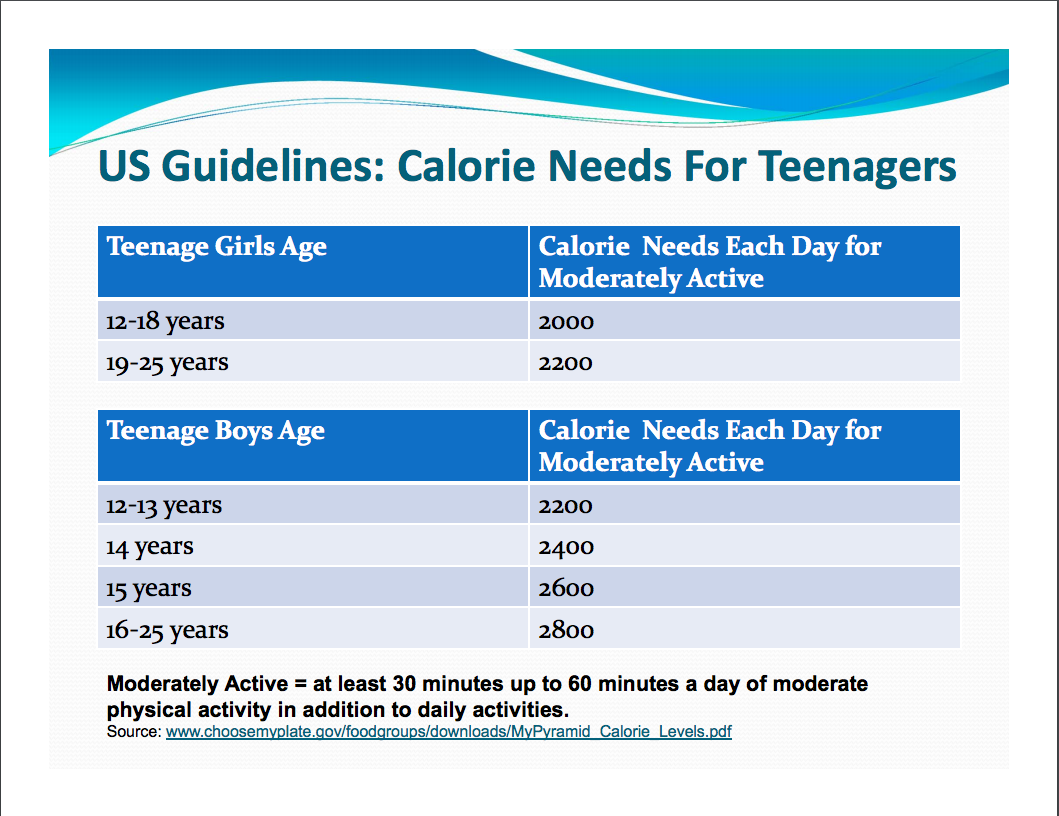
What is the right amount of calories for me?
How do I count a serving size?
How do I graphically represent data?
Assessment Processes
View how a variety of student-centered assessments are used in the Food for Thought Unit Plan. These assessments help students and teachers set goals; monitor student progress; provide feedback; assess thinking, processes, performances, and products; and reflect on learning throughout the learning cycle.
Instructional Procedures
Unit Preparation
Visit the Unit Preparation Checklist (Appendix D) for a list of tasks to complete prior to beginning this unit.
Unit Introduction
Introduce the Essential Question (or reintroduce, if using the Essential Question over several units), How can I stay healthy? Discuss the following kinds of questions:
What does it mean to be healthy?
What contributes to a healthy body?
What areas of a teenage life do you think are typically unhealthy?
When the topic of diet or eating habits is mentioned ask, "If, as the saying goes,'You are what you eat,' does that make me a cheeseburger? What does that phrase mean? Is it true? In what ways?"
Using cell phones (see how live polls work), have students take a live poll on their perceived eating habits and what foods they consider healthy. Include questions that identify:
What kinds of foods do you eat?
How healthy do you think your typical diet is?
When do you make healthy food choices?
On average, how healthy do you think the teens eat at our school?
What do you think contributes to unhealthy eating by the students in our school?
Discuss poll results and introduce the first Unit Question, How healthy are our school's students? Promote a discussion about nutrition, and record prior knowledge, interesting ideas, and questions that arise.
Phase 1: Determining Your Own Eating Habits
1. Pass out a Nutrition Learning Log (Appendix E) and a Learning Log Rubric (Appendix F) to each student. Explain to students that they will be writing in their learning logs throughout the unit to reflect on questions, record information, and document their thinking. The learning logs are an important part of the unit and assessed at the end of the unit. Therefore, the learning log rubric outlines expectations and guidelines for students to refer to while they write entries in their learning logs. Review the rubric with students and consider drafting an entry with them as an example.
Direct students to answer the question, What factors influence my food choices? in their learning logs. When writing is finished, ask students to voice their ideas, and cluster the ideas under logical categories. Some answers may include reasons such as hunger, taste, visual appeal, health, convenience, habit, novelty, cultural tradition, cost, and advertising.
Students track all they eat for seven days using the USDA SuperTracker, an online dietary and physical activity assessment tool to keep track of and assess food intake and physical activity. For extra credit or to support deeper learning for gifted students, students may choose to also track their daily physical activity. Students can use either a paper Food Diary (Appendix G) or an application on their cell phone to keep track of what they eat throughout the day and then enter the information into the USDA SuperTracker. Have students set up their accounts and enter their height, weight, age, and food already eaten that day.
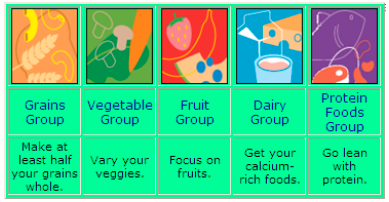
2. During this week, hold labs to understand serving sizes, portions, and how to count composite foods, like sandwiches, which may account for one meat serving, two bread servings, one vegetable serving, and one fat/other serving. Help familiarize students with the food groups by having them create large food group posters that can be posted around the classroom. Create a bulletin board area that displays in big letters the following labels:
Milk/Dairy
Meat
Vegetables
Fruit
Grains
Others
Have students cut out pictures of food from magazines, circulars, and newspapers and glue them to the appropriate banner.
3. Introduce the concept of food as fuel and the term calorie (see the in Nutrition Notes Appendix H). Show students how to find their ideal daily calorie levels as recommended in the nutrition notes calories chart. View and compare calories for various typical foods eaten from an online calorie counter or cell phone application. Ask students to reflect on one day's diet from their food diaries entered into USDA SuperTracker by using the site's analysis of their nutrient intakes, and then answer the following questions:
What is the right number of calories for me?
Do I eat the proper number of calories, too few, or too many?
How can my diet be altered so I consume the right amount of calories?
How can my activity level be altered?
Reflect on the previous day and estimate how many minutes were spent engaged in different activities during waking hours. Record the activities in the learning log. Activities might include sitting in class, sports practice, watching television, walking to school, PE class, and doing specific chores. Use an online activity calorie counter or a mobile phone application to convert the length of time for the activity multiplied by the type of the activity to get the calories expended.
4. Have students discuss their analysis of their daily activity:
What was your most common activity?
What was the most common activity of the class?
What was your most strenuous activity or activity burning the most calories?
What was the most strenuous activity recorded of the class?
How much energy did you expend for the day?
Who expended the most energy?
How many hours did the whole class spend in front of the television?
Have students enter one day's activities into the USDA SuperTracker and then analyze their physical activities and energy balance using the site's tools. Create a large classroom chart that shows common activity categories and the calories they expend. Have students create miniature versions of the chart in their learning logs.
5. Discuss food choices and the impact of small changes in diet over time. For instance, a person can choose to have a glass of milk or a can of soda with lunch — How do these drinks compare nutritionally? Have students choose two foods, research their nutritional value (using print or electronic sources), and compare them. Provide students with the Food Comparison Instructions (Appendix I) to guide them through using spreadsheet software when creating their Nutritional Food Comparison Graphs (Appendix J). Students may practice interpreting each other's graphs and record their interpretations in their nutrition learning logs.
6. After one week, students use USDA SuperTracker to help analyze the nutrient content of the foods they entered each day and compare it with dietary guidelines, nutrient intakes, and food category recommendations. They use the online graph of their eating over the week to analyze their general eating habits. Direct them to resources available at www.choosemyplate.gov. In their learning logs, students answer the question, What have I learned about my eating habits? and include specific data from the USDA SuperTracker (including the graph of their eating habits over the week) and nutritional guidelines data from the Choose MyPlate website. Direct students to analyze their data and consider questions such as:
Did my eating and nutritional values change on any specific days, why?
How did my eating change over the weekend versus weekdays?
What was surprising about my eating habits? Give specific examples.
In small groups, have students share and compare their eating habits and nutritional intake. Hold a class discussion to discuss similarities that they found in their groups and what they learned about their own eating habits.
7. Revisit the Unit Question, How can we plan and follow a healthy, nutritious, and appetizing diet? Have a brief discussion to share ideas. Using the food group banners, "Choose MyPlate" graphic depicting recommended percentages of food categories, nutrition charts from packaged food labels, and cafeteria menus from various schools as resources, students plan a day's menu for themselves that meets nutritional guidelines. Discuss with students the Essential Question, How can I stay healthy? Have students use the USDA SuperTracker and other sites to identify consequences of consistently eating an imbalanced diet.
Phase 2: Analyzing and Improving Student Nutrition
1. Introduce the project that they will undertake by focusing on the second Unit Question, How can we plan and follow a healthy, nutritious, and appetizing diet? Discuss their views on the food available on campus and possible ways it could be improved to promote healthy eating. Explain that in small groups, they will be:
Developing a research question around the Unit Questions
Collecting and analyzing data in the field needed to answer their research question, such as:
Determining the average students' nutrition
Analyzing the nutritional value of the cafeteria food
Identifying the effects of on-campus vending machines on student eating habits, and so forth.
Using their research to determine healthier alternatives that could be implemented in the school.
Creating persuasive presentations to present to the appropriate audience such as students, principal, school board, and/or district nutritionist and suggesting changes to promote healthy eating (for example, a revised cafeteria menu offering healthier choices that students would eat).
Introduce and discuss the Project Rubric (Appendix K). If you have created a project wiki or collaborative document site, introduce the site as one location for project files, calendar, and student team files and plans. Provide students with their login information.
Introduce the research process that students follow during the project and distribute the Project Checklist (Appendix L) to help students monitor their progress:
a. Identify a Question or Problem
b. Collect Data or Evidence
c. Analyze Data
d. Draw Conclusions
e. Share Findings
2. Discuss what makes a good research question. First, start by considering questions that relate to nutrition at school:
What do I notice?
What do I wonder?
What interests me?
Why does...happen?
What causes...?
Can my question be answered by collecting the right data?
Then brainstorm with the whole group some possible research questions to evaluate and/or improve nutrition at school or student eating habits, such as:
How nutritious are the foods served at school?
How active are our students in comparison with their calorie intake?
How balanced are our school's students' food intake?
How many empty calories (junk food) do our students eat?
Place students in heterogeneous groups of 3 to 5 for the project. Have student groups meet to identify the research question they will use. Have all groups post their questions and ensure questions are not duplicated. Have students record in their learning logs their group's research question and initial ideas for collecting data.
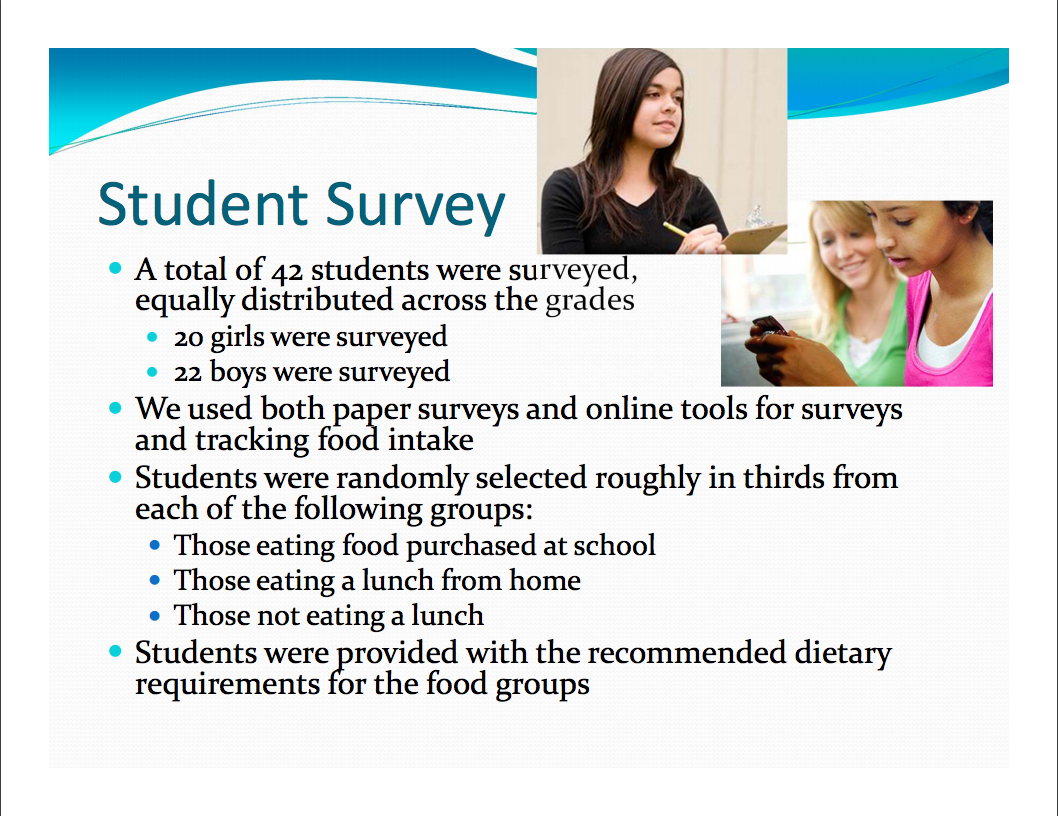
3. Based on students' research questions, prepare students for fieldwork. Identify best practices for creating surveys, identifying appropriate population, collecting data, and ensuring accuracy. Discuss the difference between quantitative and qualitative data and best uses of both. Identify various methods for recording data and ensuring accuracy. Provide and review the Survey Preparation and Design Tips (Appendix M) to students. Identify online resources to support collaborative data collection such as survey creation sites (Survey Monkey), collaborative document sites (Google Docs), online cafeteria menus from other schools, contact information for relevant school personnel, mobile phone applications for data collection, and so forth.
Have student teams meet to discuss their plans for data collection and begin initial planning. Circulate and meet with teams to ensure a practical and accurate data collection plan is in place. Pair up students from different teams to review their data collection plans and obtain feedback. Have each team review suggestions from peer feedback and incorporate appropriate suggestions. Students are to submit their final plan for data collection, including survey or interview questions, prior to field work. Have students write a summary of their plan for data collection in their learning logs.
4. Conduct mini lessons during the time students are collecting data for appropriate steps in:
Classifying data
Identifying patterns in data
Making inferences about data
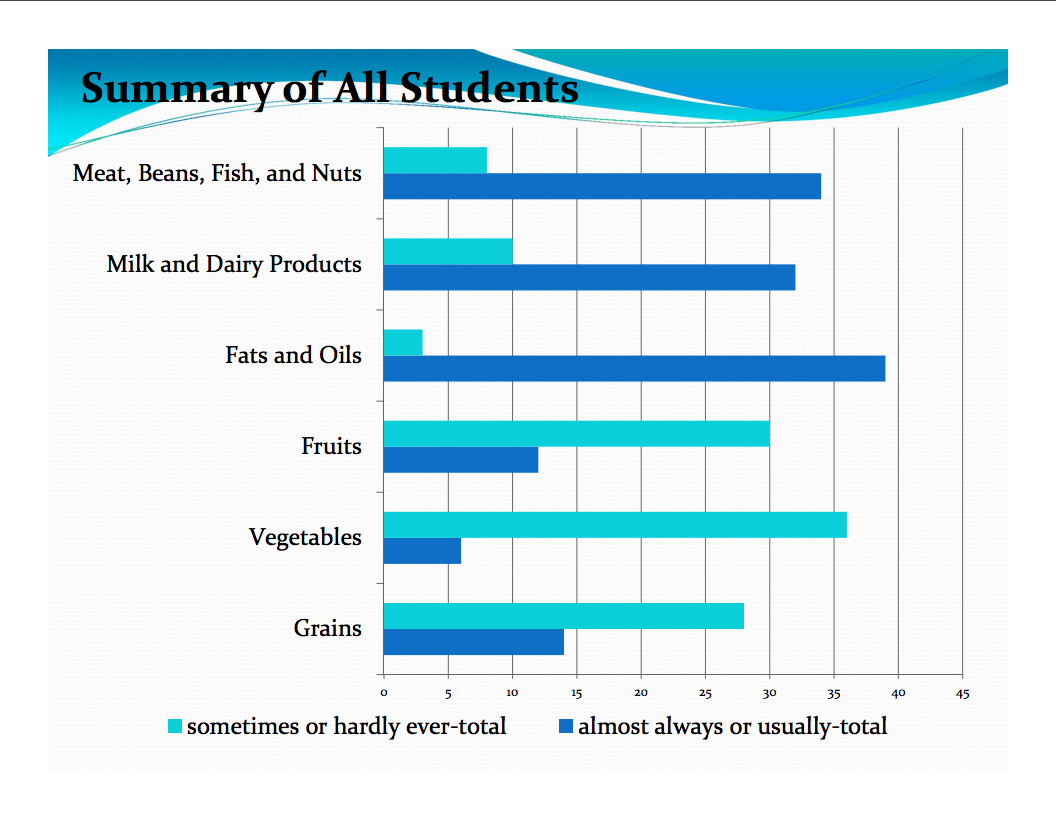
5. After data collection is complete, provide the Data Conclusions Checklist (Appendix N) to teams to support their analysis of the data. Have students write a summary of their conclusions in their learning logs, including any surprising findings or insights.
6. Have student teams research possible solutions, strategies, or school changes that could support a healthy impact on student nutrition based on their data findings. Have students identify in their learning logs the changes they are proposing and their plan for full team participation in the presentation.
7. Discuss and present samples of data presentation. Have teams identify the best audience with decision making authority for their presentations. Discuss tailoring a presentation to be appropriate for the intended audience. Review the elements of the Project Rubric (Appendix K) again that target the presentation. Provide the Data Presentation Checklist (Appendix O) to support teams in the creation of their presentations. Revisit the Unit Questions and discuss ideas as a whole class:
How healthy are our school's students?
How can we plan and follow a healthy, nutritious, and appetizing diet?
8. When presentations (Appendix P) are complete, have teams present to each other to provide and receive feedback for improvement using theProject Rubric (Appendix K). Schedule time for students to present and discuss their findings with the appropriate audience.
Phase 3: Final Assessment
Assess students' projects using the Project Rubric (Appendix K).
Ask students to write final reflections on their learning throughout the project, including learning about nutrition, conducting research, collaboration, and critical thinking.
Assess student learning with a final exam covering nutrition content such as terms, calculating serving size, the food groups, calories, and so forth.
Differentiated Instruction
Resource Student
Use online resources and tools at the appropriate reading level
Place students in heterogeneous groups so they can receive help from peers and provide assistance to others in their areas of expertise
Establish daily routines for checking progress and setting goals
Gifted Student
Extend learning through deeper analysis, such as:
Analyzing their own food intake with daily activity (calories burned)
Creating an eating and exercise plan to meet personal goals
Analyzing and comparing fast food
Comparing the cafeteria offerings from their school with another school
English Language Learner
Use calorie counter guides with images and text
Encourage the use of foods from their native culture in their research and compare their nutritional value of their native food with other types of food they eat.
Allow use of Web sites in students' first language
Place students in heterogeneous groups to support language development
Credits
A classroom teacher participating in the Intel® Teach Program developed the idea for this unit plan. A team of teachers expanded the plan into the example you see here.
Appendix
Appendix A: Unit Assessment Plan
Class discusses initial thoughts about what healthy means to them and the Essential Question, How can I stay healthy? Using cell phones, they take a live poll on their perceived eating habits and what they consider healthy to identify misconceptions, prior knowledge, and student questions. Students use an online or paper food diary(Appendix G) to keep track and assess their nutritional intake. A nutritional learning log is used throughout the unit to reflect on questions, record information, document their thinking, and summarize their learning at the end of the unit.
The learning log rubric (Appendix F) outlines expectations and guidelines for students to refer to while they write entries in their learning logs to reflect on and record their learning and to provide a grade at the end of the unit. The Project Rubric (Appendix K) is used by students as a self-assessment tool while they work on their project and by the teacher as a grading tool at the end of the unit. A Project Checklist (Appendix L) is provided to help students manage their work in a team. Survey Preparation and Design Tips (Appendix M) are provided to guide students in the preparation of an effective survey. A Data Conclusions Checklist (Appendix N) and Data Presentation Checklist (Appendix O) are provided to help students self-assess their work throughout the project. Peer reviews are conducted at key points in the project to provide feedback and fresh ideas. At the end of the unit, students take a final exam on their understanding of nutrition.
Appendix B: Unit Standards
National Health Education Standards
Standard 8: Students will demonstrate the ability to advocate for personal, family, and community health.
Oregon Science Standards
7.3S.1 Based on observations and science principles, propose questions or hypotheses that can be examined through scientific investigation. Design and conduct a scientific investigation that uses appropriate tools and techniques to collect relevant data.
7.3S.2 Organize, display, and analyze relevant data, construct an evidence-based explanation of the results of an investigation, and communicate the conclusions including possible sources of error.
Oregon Health Standards
Compare and contrast the food groups, nutrients and serving size in the USDA recommended guidelines.
Explain the importance of variety and moderation in food selection and consumption.
Student Objectives
Students will be able to:
Classify and analyze the nutritional values of foods
Identify and define the nutritional needs of students in their school
Collect, organize, classify, identify patterns, evaluate, and analyze data related to student eating habits and the food available at the school
Draw conclusions based on data on what influences student food choices, and reflect on their own and their fellow students’ eating patterns
Develop a persuasive plan to improve healthy eating choices at school
Appendix C: Unit Materials and Resources
Printed Materials
Meeks, L. (2002). Comprehensive school health education: Totally awesome strategies for teaching health, 3rd edition. Columbus, OH: McGraw-Hill Companies.
Supplies
Basic art supplies
Old magazines and newspapers (food section)
Grocery store fliers
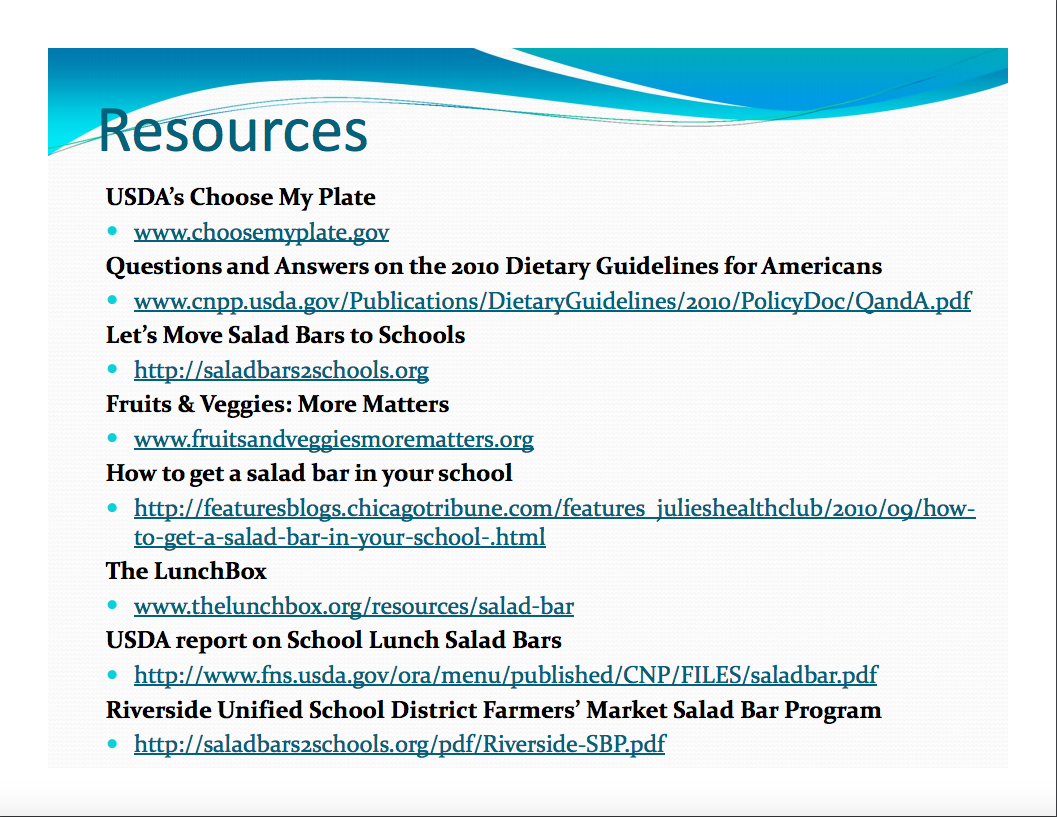
Internet Resources
Teacher Guide
Guidebook for Student Projects in Data Analysis
http://pedeefs.com/pdf/guidebook-for-student-projects-in-data-analysis.pdf
A guide for K–12 teachers in the creation of projects that incorporate data analysis.
Topics include:Asking the Question
Collecting the Data
Organizing and Analyzing the Data
Completing the Project
Assessing the Project
Nutrition Data Trackers
Activity Calorie Counter
https://www.healthstatus.com/calculate/cbc
A calculator for calories burnedCalorie Control Council's Enhanced Calorie Calculator
www.caloriescount.org/calculator.html
Calorie calculatorChoose MyPlate
www.choosemyplate.gov
USDA’s Web site containing information on food groups, the revised 2010 nutritional guidelines, specific food nutrition information, creating a personalized plan or menu, analyzing one’s diet, and teacher and student nutrition resources.Smartphone calorie counter applications:
MyFitnessPal
fatsecret
USDA SuperTracker
https://www.supertracker.usda.gov/
An online dietary and physical activity assessment tool to keep track of and assess food intake and physical activity. Analyzes the nutrient content of the foods you enter for one day and compares it with dietary guidelines, nutrient intakes, food pyramid recommendations. Will also analyze and graph your eating over time.
Polling Resources
Poll Everywhere
www.polleverywhere.com
Quick response polling site. Participants can use Twitter*, text messaging, web-enabled phones, or the Web to respond. ·Polldaddy
http://polldaddy.com
Online survey – to collect nutrition survey information and/or cafeteria feedbackSurvey Monkey
www.surveymonkey.com
Online survey – to collect nutrition survey information and/or cafeteria feedback
Nutrition Information
Fast Food Facts
http://www.fastfoodmarketing.org/
Nutritional information on fast foodFDA’s Food Safety & Nutrition Information for Kids and Teens
http://www.fda.gov/food/resourcesforyou/consumers/ucm2006971.htm
Nutritional informationTeensHealth from Nemours
"What's the right weight for my height?"
http://kidshealth.org/en/teens/weight-height.html
Includes BMI calculatorWhat’s in a Food Label
http://www.healthchecksystems.com/label.htm
Shows information about what is on food labelsWIN:Weight-control Information Network
Take Charge of Your Health: A Guide for Teens
https://www.niddk.nih.gov/health-information/health-topics/weight-control/take-charge-your-health/Pages/take-charge-your-health.aspx
Understanding healthy foods, serving sizes, food labels
Technology—Hardware
Internet-connected computers for research, data input, analysis, and presentations
Projection system for lessons and presentations
Optional: Student cell phones for recording observations, surveys, food intake, exercise, and photos of food
Optional: Digital camera for photos of cafeteria and student lunches
Technology—Software
Spreadsheet for entering and analyzing data
Presentation software for presenting cafeteria recommendations
Appendix D: Unit Preparation Checklist
The Nutrition Notes (Appendix H) sheet summarizes many of the concepts addressed in this unit. The information is presented as background for teachers, but you may want to make copies for students as well.
Print copies or provide access to an online version of the Nutrition Learning Log (Appendix E).
Print copies of all assessments and provide access online.
If desired, create a class project wiki or collaboration document site to provide one location for project files, calendar, and student team files and plans. Create student accounts or have students create their own accounts on first access.
Prepare for labs on calculating food servings to include various foods, scales, and food charts.
Test USDA SuperTracker on student computers to ensure access.
Contact school personnel who may be resources for teams to obtain data, such as the dietician, cafeteria supervisor, finance analyst, and so forth. Discuss project and ask if they would be willing to meet with students. Obtain their contact information.
Contact school personnel with decision making authority on nutrition matters such as the principal, school board, district dietician, teacher in another class for presentation to students, and so forth. Discuss project and ask if they would be willing to hear and consider student presentations. Obtain their contact information.
Set up an online live poll using Poll Everywhere for initial student opinions on nutrition during the unit introduction. Students take a poll using cell phones or online devices and share with other students who may not have the right equipment. Obtain parent permission to text replies using student phones to ensure no costs will incur according to their mobile phone plan.
Appendix E: Nutrition Learning Log
Date: ____________________________________________
Name: ___________________________________________
Prompt for today:
My response:
Appendix F: Learning Log Rubric
4 | 3 | 2 | 1 | |
Recording | ||||
Example: The following chart shows the foods I ate today, listed in the appropriate categories and then created a pie chart. From the Web sites we researched, I learned roughly half of the food we eat each day should be fruits and vegetables. I was really surprised at how unhealthy I eat when I recorded it all. Now that I know, I wonder if it will make a difference in the food choices I make over the next few days. | I neatly, thoroughly, and accurately record data in usable, appropriate formats, such as charts, lists, outlines, and diagrams. When I read about a topic or listen to information that is presented, I take notes in my own words to show the difference between important information and supporting details. I include connections, predictions, and questions about the topic. | I record data in appropriate formats. When I read about a topic or listen to information that is presented, I take notes in my own words to show the difference between important information and supporting details. | I try to record data accurately, but I sometimes choose a format that is not appropriate, and some of my data may be inaccurate. When I read about a topic or listen to information that is presented, I try to take notes in my own words, but sometimes, I just copy what I read or hear exactly without showing what information is important. | I often do not record data accurately. When I read about a topic or listen to information that is presented, I copy exactly what I read or hear without thinking about it at all. |
Exploration | ||||
Example: We’re planning how to get students’ opinions on food, nutrition, and cafeteria food. We could split up our group and have a cell phone survey in home room, or choose people at random at lunchtime, or create an online survey. We need to see which way would get the best cross sample. | I can explore many different ideas in my writing without worrying about which ones are good. I accurately and completely describe my feelings about past and present experiences and people, and my expectations about future events. | I can explore different ideas in my writing. I describe my feelings accurately. | With help, I can explore some ideas in my writing. With help, I can describe my feelings. | I do not explore ideas in my writing. I cannot describe my feelings. |
Reflection | ||||
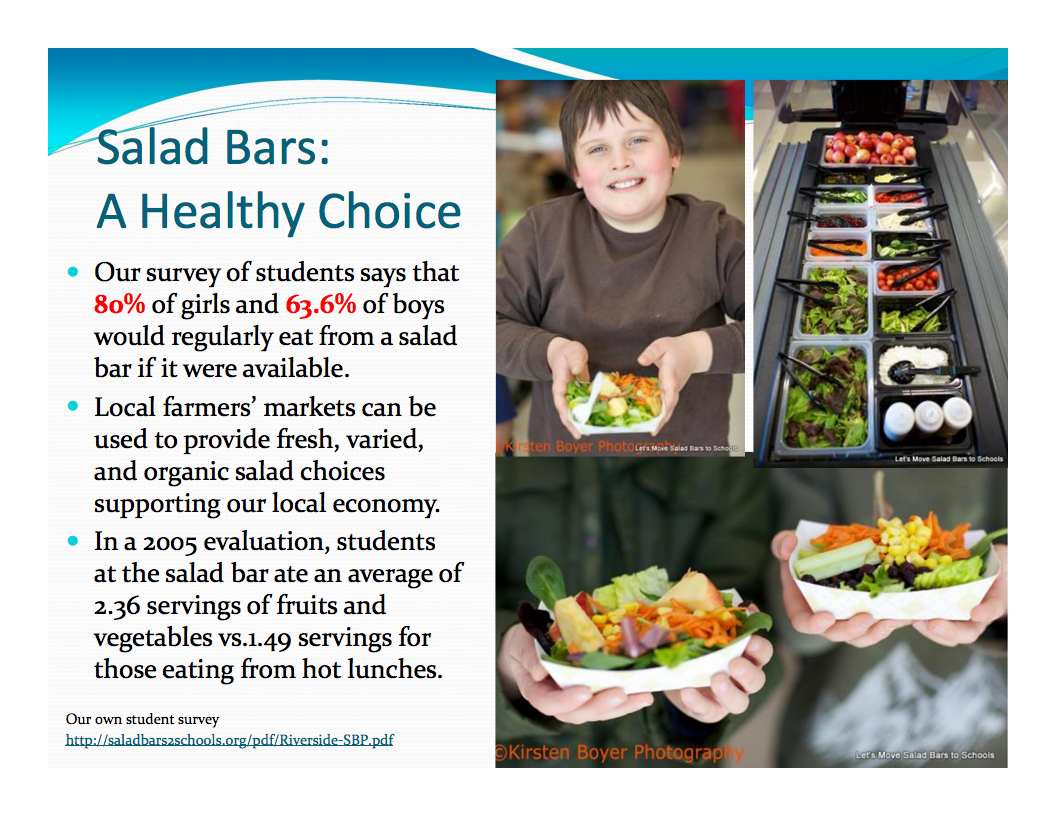
Example: I know when our team goes for pizza after a game and there’s a salad bar, a lot of the team chooses a salad even if they have pizza. I know I like to be able to choose my own toppings for salad and eat more fruits and vegetables when a salad bar is available. I wonder how we could get an accurate reading on how many students would use a salad bar if the school installed one. I don’t think we surveyed enough people last time, so we’ll have to make sure we can get a good sample in our next survey. | I write about what I am learning by explaining how the new learning connects to what I already knew or believed before. I explain how my thoughts have changed, and what questions I still have, I describe what is important about what I have learned. I thoroughly explain my working and thinking processes and analyze what went well and what I could do differently and better. | I write about what I am learning from my own experiences. I explain my working and thinking processes and write about how I could improve them. | I have difficulty writing about what I am learning from my own experiences. I describe my processes in vague language, and at times, I think about how I could improve them. | I do not write about what I am learning from my own experiences. I do not describe my processes or think about how I could improve them. |
Goal Setting | ||||
Example: Over the last three days, I see from my online nutrition log that I’m not eating nearly enough fruit, which is surprising since I like fruit. I think we just need to buy more variety when we shop. I’ll add different kinds to the shopping list and make an effort to choose a fruit for at least one of my snacks. | I use my analysis of my own learning styles and understanding of the subject to set goals for future learning. I use my learning log to check on how well I am progressing toward my goals and to change them if I need to. | I use my analysis of my past learning to set goals for the future. I check to see how I am doing at achieving my learning goals. | Sometimes, I set goals for future learning. Sometimes, I check on my goals, but sometimes, I forget all about them. | I hardly ever set learning goals for myself. I expect my teacher to set them for me. When I set goals, I rarely check to see if I am making progress to achieve them. |
Conventions | ||||
Example: My teacher reminded me not to write in “text-speak”—in other words, not to use shortened spellings and acronyms like we use for texting. I text so often that sometimes I forget how to spell a word correctly! | I write so that I can read and understand what I have written, and if someone else is going to read my learning log, I follow the conventions so the audience can understand it. | I usually write so that I and others can read and understand what I have written. | I try to write so I and others can read what I have written, but sometimes, I cannot figure out what I was trying to say. | I often cannot figure out what I was trying to say in my learning log. |
Appendix G: Food Diary
Name: _______________________________________________ Date __________________
Write down the foods you eat today. Color in your food eaten in the appropriate spaces on the MyPlate graphic. Write down the foods you eat that belong in the “Others” category. Count composite foods in each category. For example, a ham and Swiss cheese sandwich with mayonnaise, lettuce, and tomato would count as: 1 meat serving, 1 dairy serving, 2 bread servings, 1 vegetable serving, and 1 “Others” serving.

Breakfast: |
Lunch: |
Dinner: |
Snacks: |
Others: |
Answer these questions:
Did you get all the proper servings from each food group?
Is your plate completely colored in?
How many servings of “Others” foods did you have?
Appendix H: Nutrition Notes
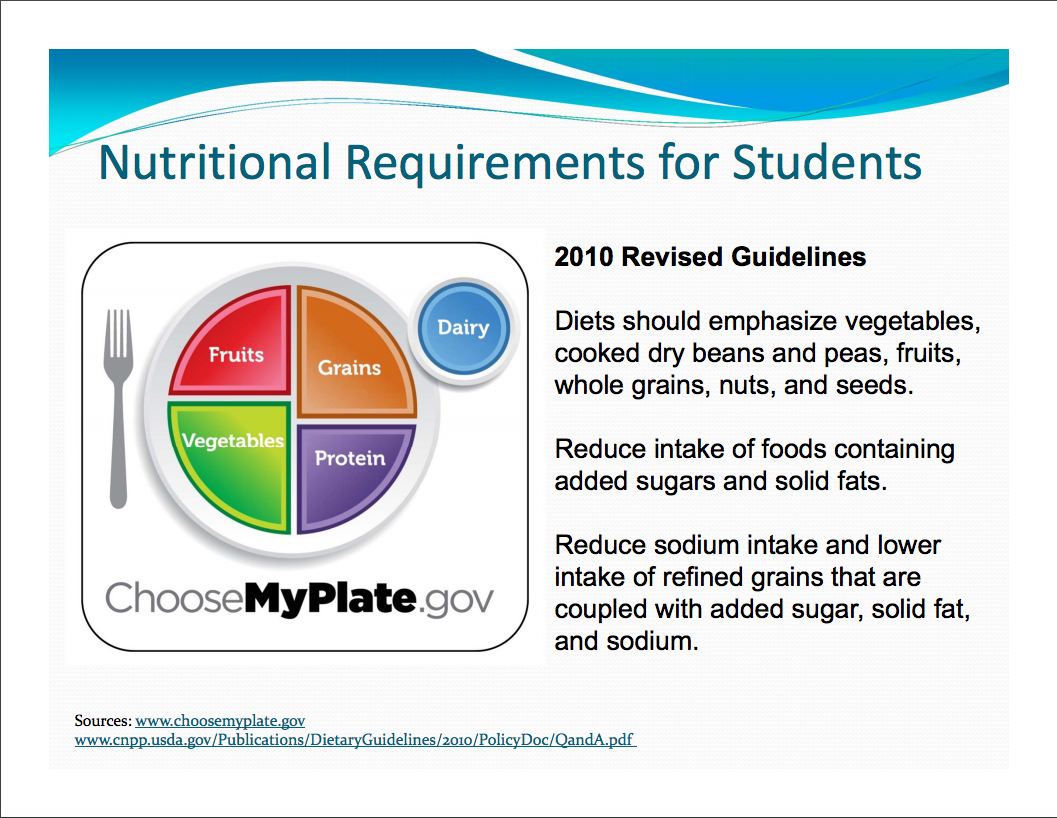
The 2010 Key Recommendations for food group intake are directional rather than providing the precise quantitative amounts that should be consumed. The following guidelines are identified:
Balancing Calories
Enjoy your food, but eat less.
Avoid oversized portions.
Foods to Increase
Make half your plate fruits and vegetables.
Make at least half your grains whole grains.
Switch to fat-free or low-fat (1%) milk.
Foods to Reduce
Reduce daily sodium intake to less than 1,500 mg.
Drink water instead of sugary drinks
Food as Fuel: Calories
A calorie is defined scientifically as the amount of energy required to raise the temperature of one gram of water by exactly one degree Celsius. For nutritional purposes, a calorie is a standard measure of how much energy is delivered in the different foods you eat. When you eat, your body converts food to fuel, and burns it through bodily functions and activity. Vigorous exercise requires a lot of caloric fuel. When at rest, your body needs fewer calories, but some energy is needed to keep your bodily systems going—digestion, respiration, and so on. To stay even (and not get too fat or too thin), you should consume the same number of calories you burn. If you consume many calories but aren’t active, the energy has nowhere to go, and it is stored as fat. In primitive times, a store of fat was helpful, because food could become scarce at times, and a body could draw on stores of fat to get through lean times. In these plentiful times, storing body fat isn’t necessary, and, in your diet, fat should account for less than 30 percent of all the calories consumed.
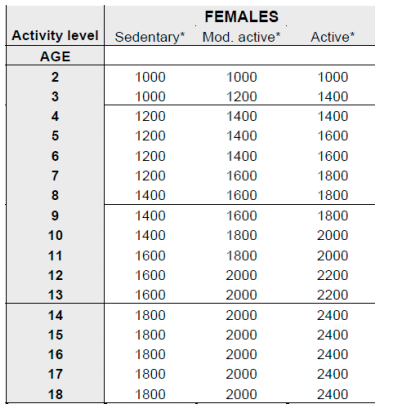
USDA Recommended Daily Calories
MyPyramid assigns Individuals to a calorie level based on their sex, age, and activity level.
Sources:
http://en.wikipedia.org/wiki/Calorie
Appendix I: Food Comparison Instructions: Making Choices
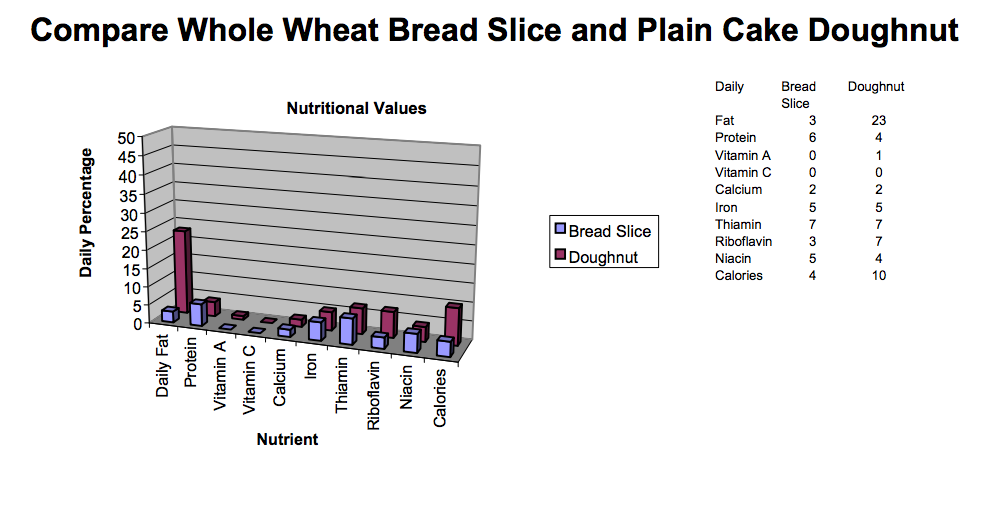
Description: You are going to investigate the nutritional value of two foods. You will begin by choosing two foods that seem similar yet different (such as lowfat milk and soft drinks or whole wheat bread and donuts), research their nutritional value using print or electronic sources, and compare them. You will use a spreadsheet to create nutritional food label graphs.
Step 1: Choosing Food
Choose two foods that seem similar yet different and research their nutritional value using print or electronic sources.
Step 2: Creating a Worksheet in Spreadsheet Software
Open a worksheet in a spreadsheet application. In cell A1, type the title Nutritional Food Label Graphs. In row 3, beginning in cell A3, type the headings Daily, [name of your food choice], and [name of your second food choice]. In column A, beginning in cell A4, list all of the nutrients that you found for your foods (such as fat, protein, vitamin A, Vitamin C, Calcium, Iron, and so forth).

Step 3: Building a Chart
Use the Chart Wizard to produce a chart. Choose the chart type that best represents the data, such as a bar graph or column chart, and then work through the Chart Wizard. For example, to create a Column chart in Microsoft Excel using the sample table shown earlier, follow these steps:
After you add data to the table, highlight cells A3 through C13.
Choose Chart on the Insert menu.
Click the Column chart type, and then click the Next button.
Click the Data Range tab, make sure Columns is selected next to Series In, and then click Next.
In step 3 of the Wizard (Chart Options), click the Titles tab.
Add titles for the chart and its axes.
Click the Gridlines tab, and experiment with gridline options.
Choose the gridline option that makes understanding your data easy.
Click the Legend tab, choose a location for the legend, and then click Next.
Place the chart as an object on the original worksheet, so you can see the worksheet entries while you examine the chart.
Appendix J: Sample Nutritional Food Comparison Graphs

Appendix K: Project Rubric
4 | 3 | 2 | 1 |
Project Theme | |||
My presentation has a clear theme focusing on identifying and changing student nutrition habits. My presentation engages my audience, ties the topics together, and provides strong persuasion to make the changes we suggest. | My project presentation has a clear theme that ties the presentation together. | My project presentation is mostly a collection of separate pieces of information loosely tied together. | My project presentation is a collection of separate pieces of information. |
Scientific Content | |||
All nutritional content in my presentation is accurate, well-researched, and cited, when necessary. | All nutritional content in my presentation is accurate and cited correctly. | Most of the nutritional content in my presentation is accurate and occasionally not cited. | Much of the nutritional content in my presentation is inaccurate and not cited |
Data | |||
My project refers to extensive, relevant data that is represented effectively to support my conclusions. | My project refers to relevant data that is represented effectively to support my conclusions. | My project refers to limited data which is mostly relevant. The visual display of my data is rather confusing. | My project refers to very little relevant data and it is displayed ineffectively. |
Conclusions | |||
I synthesize my own experiences with my scientific knowledge and research to draw important and meaningful conclusion by making predictions, and correctly linking causes and effects about improving student nutrition. | I synthesize my own experiences and scientific knowledge with my research to draw conclusions about improving student nutrition. | I try to use my knowledge and research to draw conclusions, but some of my ideas are not logical or based on credible evidence. | I rarely draw conclusions, and when I do, they are not logical. |
Argumentation | |||
I clearly describe my plan for improving student nutrition. | I state a plan for improving student nutrition. | I vaguely describe my plan for improving student nutrition. | It’s unclear what my plan is for improving student nutrition. |
I think about my audience and include information that is likely to persuade my audience to agree with my plan. | I think about my audience when I organize my argument, and I try to address my audience’s concerns and needs. | I try to think about my audience when I form my argument, but I often fail to address my audience’s concerns or needs. | I do not think about my audience’s needs or concerns when I put together my argument. |
I predict what people who disagree with my position will say, and I address their points in my argument. | I explain why positions I do not agree with are wrong. | I sometimes do not address positions that disagree with my position in my argument. | I do not address positions that disagree with my position in my argument. |
Use of Multimedia | |||
I use graphics, video, audio, and other multimedia features effectively to communicate my theme and create interest. I follow all copyright laws when I use multimedia features. | I use some graphics, video, audio, and other multimedia features to enhance and support my key points. | I use graphics, video, audio, and other multimedia features, but some features detract from my key points. | I do not use graphics, video, audio, or other multimedia features, or the ones I use detract from my key points. |
Creativity | |||
My project includes unique features and ideas that communicate in unusual and surprising ways. | My project communicates insights in unusual and surprising ways. | I try to communicate fresh insights in unusual and surprising ways, but some of my methods distract rather than support my project’s theme. | My project is predictable. |
Oral Presentation | |||
I speak clearly and smoothly in an engaging way, maintain eye contact, and show poise and confidence when handling unexpected problems effectively. | I speak clearly and smoothly. I show poise and audience awareness. | I could have rehearsed my project more carefully. Sometimes, my audience loses interest or has difficulty understanding me. | My audience has difficulty following my project and understanding me. I did not practice enough. |
Appendix L: Project Checklist
Identifying a Question
Our team has identified an open-ended research question that focuses on an element of the Unit Questions, How healthy are our school’s students? and/or How can we plan and follow a healthy, nutritious, and appetizing diet? The question allows for a way to suggest nutritional improvements or changes at the school.
We have reviewed the Project Rubric to ensure our research question will meet the project criteria.
We have recorded in our learning logs our group’s research question and initial ideas for collecting data.
Collecting the Data
We have identified the data we need to gather to provide background information for our research question, help determine nutritional problems and solutions, and identify persuasive data for our recommended changes.
We have identified who or what can provide the data to support our research question.
We have identified the process by which we will collect the data.
We have fairly divided the tasks so that all members of the group have significant tasks to complete.
We have reviewed the Survey Preparation Design Tips document prior to creating a survey.
We have created survey, interview, and/or research questions that will provide useful data when answered by the appropriate audience.
We have met with students from different teams to review their data collection plans and obtain feedback.
We have incorporated feedback that we feel will enhance our data collection process.
We have submitted our questions for review to the teacher prior to collecting the data.
We have written a summary of our plan for data collection in our individual learning logs.
We have collected the data, entered the data into a spreadsheet, and double checked accuracy.
Analyzing the Data
We have reviewed and used the appropriate checklist for the type of data we collected to help us analyze the data. (Quantitative Data Conclusions Checklist and/or Qualitative Data Conclusions)
We have summarized the data and sorted the data in different ways to compare and come up with a variety of insights.
Drawing Conclusions
We have come up with some conclusions as they relate to our research question.
We have written a summary of our conclusions in our individual learning logs, including any surprising findings or insights.
We have researched possible solutions, strategies, or school changes that could support a healthy impact on student nutrition based on our data findings.
We have identified in our individual learning logs the changes we will propose and our plan for full team participation in the presentation.
Sharing Findings
We have reviewed and used the appropriate checklists for the type of data we collected to help us present the data (Quantitative Data Presentation Checklist, Qualitative Data Presentation Checklist, and Data Display Checklist)
We have reviewed the Project Rubric to ensure our presentation meets or exceeds expectations.
We have entered our proposal, the specific data to support it, and counter arguments into Showing Evidence.
We have received reviews of our Showing Evidence argument from another team and have incorporated appropriate suggestions.
We created a multimedia presentation with easily-understood graphs, charts, and images to support our proposal with the targeted audience in mind.
We have considered whether any handouts, summaries, or posters of our data and/or proposal would be helpful to the targeted audience. If so, we have created them.
We have self-assessed our presentation with the Project Rubric.
We have practiced our presentation with another team and have incorporated appropriate suggestions.
Appendix M: Survey Preparation and Design Tips
Use these tips to plan and design your survey to collect data for your project.
Data collection planning: Whether collecting data through the creation of an online survey or collecting data from the Internet, plan before gathering:
Review your project question(s). What are you trying to discover?
What actions do you want to take as a result of the survey?
Visualize all the relevant information that you need. What kind of charts, graphs, or other visual representations will you need to prepare?
Who is your target audience? What is the best way to reach that specific audience?
(Bhaskaran, ND)
Introduction: Create an introduction that explains the purpose of the survey in the context of the project.
Precise, clear, concise: Make sure questions are easy to understand and can be completed in a reasonable amount of time. Participants are likely to submit incomplete surveys if a survey seems too long or complicated. If feasible, conduct a trial run of the survey and get feedback before using your “official” survey.
Logical sequence:
Check that initial questions do not bias the results of questions that follow.
Typically, ask broader questions first and more specific questions later.
Ensure that the order of the possible responses is logical and consistent. For instance, if you ask respondents to select from a scale, make sure the order of the scale is consistent throughout the survey (always from low to high or high to low).
Well-suited questions: Consider the type of question that is best suited to meet your needs. Multiple choice questions are the easiest to graph and compare, but you may need some open-ended questions to allow for broader, more qualitative feedback and data.
Balanced questions: Avoid questions that lead to certain answers.
Provide options: For questions with multiple-choice options, always include a response such as “Other” or “Does not apply,” so everyone can respond accurately.
Bhaskaran, V. Online Research: A Handbook for Online Data Collection http://www.questionpro.com/images/Online-Research-Handbook.pdf
Appendix N: Data Conclusions Checklist
Use this checklist to help you analyze qualitative and/or quantitative data and reach some conclusions.
If you need to analyze and make conclusions about Quantitative data (data that can be counted or expressed numerically; data based in numbers that can be shown on tables, charts, graphs, and so forth), use the Quantitative Checklist.
If you need to analyze and make conclusions about Qualitative data (not numerical—such as notes on observations, photographs, observations, maps, written documents, and so forth; qualitative data can be categorized and counted), use the Qualitative Checklist.
Quantitative Checklist
Use this checklist to help you analyze quantitative data and reach some conclusions.
1. Make sense of the numbers.
Write simple descriptions about the characteristics you see in the data.
Look for significant differences between groups and/or relationships between variables.
2. Summarize the data. If useful in the interpretation of your data, identify the:
Mode
Median
Mean
Range of data points
Significance of data points—describe what they reveal
3. Try various methods of displaying the data.
Identify a visual means of presenting your data that communicates the meaning most clearly. What did you choose?
4. Infer from a sample to the whole.
If appropriate, what conclusions can you draw about a whole population based on the results of your sample?
Do you see any correlations between any of the data?
Is there any causation to note that can be proven?
5. Relate the data to your original question.
Infer conclusions about the data as they pertain to your research question, hypothesis, or problem.
Qualitative Checklist
Notice
Step back from the data and allow yourself to notice patterns and themes. Note the method you used:
Spread out a color-coded transcript to visually identify color patterns
Read various primary source data and noticing repeated words and themes
Arrange photos on-screen to view them all at once to find commonalities or differences
Other:
Focus
Intensely focus on just one area of the data. Jot down notes, thoughts, and scribbles.
Think about and play with rearranging, sorting, sifting, and comparing the data in order to see possible patterns, themes, sequences, processes, and categories.
What did you find?
Discover
Allow discoveries to emerge, such as patterns, sequences, processes, wholes, classes, types, and categories. Let these initial discoveries help you notice new things in your data. Take notes throughout the process.
Consider conducting additional research or follow-up surveys if new and unexpected questions arise.
What did you find?
Theorize
From your observations, come up with a hypothesis, theory, summary, or anecdotal representative “story.” Note it below.
Appendix O: Data Presentation Checklist
Use this checklist to help you present research supported by quantitative and/or qualitative data, as well as to create effect charts and graphs.
If you need to present Quantitative data (data that can be counted or expressed numerically; data based in numbers that can be shown on tables, charts, graphs, and so forth), use the checklist for Presentation of Quantitative Data.
If you need to analyze and make conclusions about Qualitative data (not numerical—such as notes on observations, photographs, observations, maps, written documents, and so forth; qualitative data can be categorized and counted), use the checklist for Presentation of Qualitative Data.
To get help with charts and graphs, and to know which type to use, use the checklist for Effective Data Display.
Presentation of Quantitative Data
Use this checklist to help you present research supported by quantitative data.
1. Provide an overview of the data collection process. Help viewers understand the process. Include:
Method used to collect data
Size and selection criteria of the sample
Number of responses versus requests for participation
Location where the sample was gathered
Range of time in which the data was collected
2. Create the visual representation for the data. Which graphs or charts best tell the story? Determine:
The appropriate graph type for displaying the data to help the viewer understand the results. What types of charts and graphs will you use?
How best to set up each chart or graph. Remember to include:
The independent variable on the x-axis and the dependent variable on the y-axis
A helpful title
Correctly labeled axes, including units of measurement
A key or legend for multiple trials or examples
The proper scale for the lowest and highest values on the axes
Correctly and clearly plotted data
3. Summarize findings. Focus and make your point. Remember to:
Relate the results to the research question
Summarize results and include key facts from the background research or any qualitative data
Evaluate the procedure, making comments about its success and effectiveness
Presentation of Qualitative Data
Use this checklist to help you present research supported by qualitative data.
1. Provide an overview of the data collection process. Set up the context for the research. Include:
The choices you made as you decided how to construct your study
How you formed the research questions
What you studied
How and why you selected a site, collected resources, or determined the subject(s) of study
Whether you chose a particular case study, example, or story to highlight, and if so why you chose that one
Whether others helped you with the data collection process, and if so, how you worked together as a team to ensure consistency in your work
2. Create the visual representation for the data. Determine the best way to present or support your selected themes, categories, or features. Determine:
The appropriate charts or graphs you will use to depict the central tendencies, ranges, or frequencies
What you will select to represent so as to focus on the most important aspects of your study and the number of examples to present per category
How much of the original data you will have available as “backup” and supplemental resources, such as:
Complete transcripts
Digital photos of all the artifacts
All the photos under study
Full survey responses
3. Summarize findings. Focus and bring home your point. Consider:
Telling the story of your data through a summary
Thinking like a novelist and creating a setting in which to place your characters and data. Create a clear picture of the setting to form a perspective from which to judge your observations.
Placing data in context. Determine what the audience will need to know to have a clear understanding of the bigger picture.
Following the "just one thing" rule. Concentrate on one aspect of your study—that which really stands out or makes your point the best.
“Juxtapos[ing] data excerpts with your talk about the data. Be it in the presentation of categories, themes, taxonomies, typologies, pictures, or drawings, the essence of presenting qualitative research comes down to how well you are able to juxtapose the data with your descriptions, explanations, analysis, or commentaries” (Chenail, 1995).
Effective Data Display
Use this checklist to help you create effective charts and graphs.
General Tips for Charts and Graphs:
For most charts and graphs, place your independent variable (such as time) on the x-axis (horizontal) and the dependent variable (such as plant growth) on the y-axis (vertical).
Label the axes, including units of measurement.
If you have more than one set of data, show each series in a different color.
Include the sources for the data.
In bar graphs, make bars and columns wider than the space between them.
In pie charts, ensure that the segments are ordered by size (largest to smallest) and in a clockwise direction.
Use a Bar Graph to:
Compare categories and groups of data.
Represent quantitative and qualitative data.
Show frequency of each element in a set of data.
Show speed or distance
Show less than 10 items
Provide more room for text labels (horizontal bars)
Illustrate a change in magnitude or frequency (vertical bars)
Use a Stacked Bar Graph to:
Compare different groups while showing subgroups.
Show just a few groups of data.
Use a Line Graph to:
Compare relationships between two variables to show how they relate to each other.
Indicate quantity (dollars, units, percentages) on the y-axis and measure time on the x-axis to illustrate change over time.
Show change in direction and trends in different groups of the same type.
Use a Pie Chart to:
Compare parts of a whole, percentages of a total, or summary of a set of data organized by categories that have no natural order.
Show quantitative or qualitative data.
Display no more than six segments.
Show segments with actual values or percentages.
Use a Scatter Plot to:
Show measurements of two or more related variables.
See trends in a large group of data points and find outliers, or data points that do not seem to belong.
Use a Pictograph to:
Convey the meaning of statistical information in a simplified fashion, such as images on a chart.
Symbolize data in a dramatic way, such as a size change of an image to represent changing data values.
Chenail, R.J. “Presenting Qualitative Data.” The Qualitative Report, Volume 2, Number 3, December, 1995. http://www.nova.edu/ssss/QR/QR2-3/presenting.html
Appendix P: Student Sample Presentation

Appendix Q: Terms of Use and License
Terms of Use
These resources provided by Intel Education are 'open' and are available for educational use. Many hold Creative Commons licenses that allow them to be repurposed, modified and adapted for a diverse array of local contexts.
Each resource has one of three conditions of use labels. These at-a-glance labels can help you quickly distinguish whether a resource can be changed or shared without further permission required. In addition, you can find the specific license or terms of permitted use for each resource.
Remix and Share Your remixing, redistributing, or making derivatives works comes with some restrictions, including how it is shared. Includes Creative Commons Attribution Share Alike (CC BY-SA), Creative Commons Attribution NonCommercial Share Alike (CC BY-NC-SA), Creative Commons Attribution NonCommercial (CC BY-NC), GNU Free Documentation License (GFDL);
Share Only Your redistributing comes with some restrictions. Do not remix or make derivative works. Includes Creative Commons No Derivatives (CC ND).
Read the Fine Print Everything else. All Rights Reserved. US-based educators have certain permissions under Fair Use and the TEACH Act. Includes educational and personal uses of copyrighted materials, custom licenses and terms, permission to print only, unknown restrictions, and any other redistribution restrictions of the DMCA and of your own country.
License
All Intel® Education Content is protected under U.S. and international copyrights. Intel Education owns and retains all rights, title and interest, including all rights under copyright, in and to all Intel Education Content. Your rights to use, share and adapt Intel Education Content under the Creative Commons (“CC”) License are merely those of a non-exclusive licensee, and you do not acquire copyright ownership with respect to any Intel Education Content.
Except as expressly otherwise noted, all Intel Education Content (including Intel Education Curriculum Material) is made available to Users in accordance with the Creative CommonsAttribution-Noncommercial 3.0 Unported (CC BY-NC) License (http://creativecommons.org/licenses/by-nc/3.0/), as amended and updated by Creative Commons from time to time (the “CC BY-NC License”), which is incorporated herein by this reference.
The CC BY-NC License allows you to freely share and adapt Intel Education Content, provided that:
You give proper attribution to Intel Education in the manner specified by Intel Education, but not in any way that suggests that Intel Education endorse you or your use;
You may not use, copy, reproduce, perform, display, distribute, transmit, disseminate, modify, adapt, create derivative works from, or otherwise exploit Intel Education Content for commercial purposes, including for commercial advantage or private monetary compensation;
For any reuse or distribution of Intel Education Content, you must make clear to others the CC BY-NC License terms (the best way to do this is with a link to http://creativecommons.org/licenses/by-nc/3.0/); and,
You comply with all other requirements as may be specified in the CC BY-NC License. The CC BY-NC license supersedes and replaces any Creative Commons license previously adopted by Intel Education for Intel Education Content.
NOTE: Notwithstanding the above, the CC BY-NC License does not apply to photos, images and other materials contained in Intel Education Content which have been licensed by Intel Education from Shutterstock.com and/or other commercial stock photo/image agencies (you can easily identify such a photo or image by looking at the credit embedded within or associated with the photo or image) (each, a “Licensed Stock Photo”). You are allowed to retain a copy of a Licensed Stock Photo for your own personal, non-commercial use only, BUT (i) you may not modify, alter, adapt, or otherwise create any derivative work from a Licensed Stock Photo and (ii) you may not distribute, transmit or disseminate a Licensed Stock Photo or any copy or derivative work thereof, to any third party, whether by itself, as part of Intel Education Content, as part of your Curriculum Contributions, or otherwise.
If you wish to use Intel Education Content for commercial purposes, you must contact Intel Education to enter into a separate license agreement governing commercial use of the Intel Education Content.
If you do not agree to the terms of the CC BY-NC License, please refrain from using Intel Education Content in any manner, including downloading, copying, reproducing, printing, editing, modifying, distributing or transmitting such content, in any media or by any means, whether now known or hereafter developed. If you accept the terms of the CC BY-NC License and proceed to use any Intel Education Content, then any breach or violation by you of the CC BY-NC License will automatically constitute a violation of the TOU and may subject you to liability to Intel Education for copyright infringement. Also, to the extent you have violated the CC BY-NC License and made modifications or improvements to, or have prepared derivative works based upon, Intel Education Content or have otherwise incorporated Intel Education Content into your own content for commercial purposes, your violation of the CC BY-NC License will automatically subject such modifications, improvements or derivative works by you, or your own content that is mixed with Intel Education Content, to a perpetual, royalty-free, worldwide license to Intel Education, and Intel Education may, in its sole discretion, elect to exercise the foregoing license in addition to or without prejudice to any other remedies available.