What Happened to Robin?
Unit Plan
Unit Summary
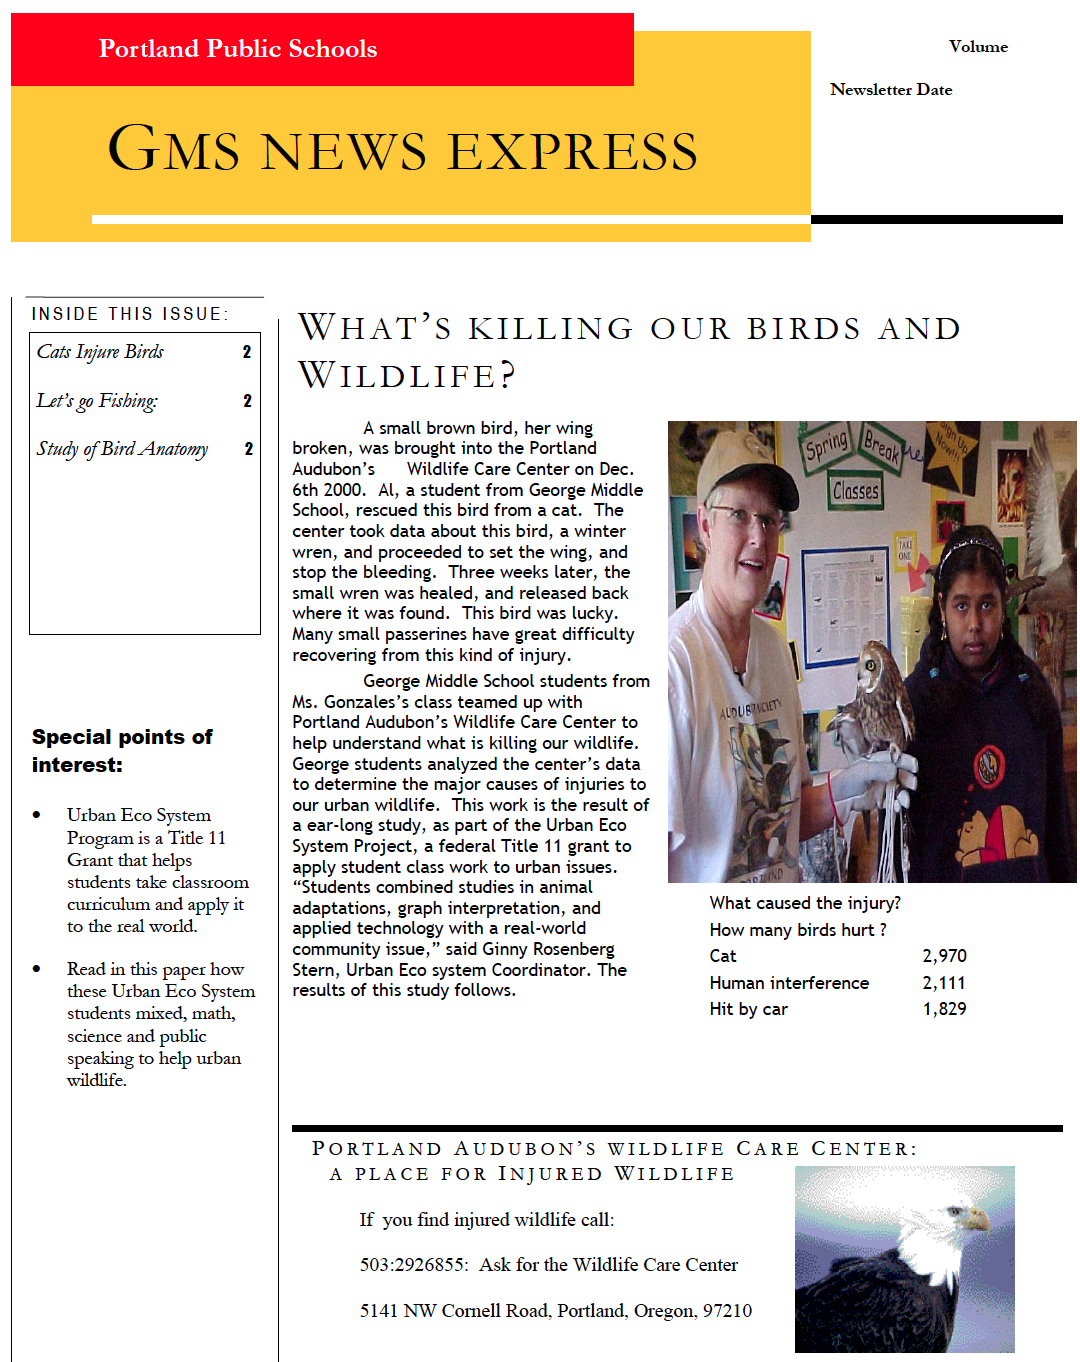
Using actual wildlife injury data from a local wildlife rescue center, students learn what animal species have been injured and the causes of injury. Students use spreadsheet software to sort, organize, and evaluate their findings for recommendations to reduce human-caused injury to wildlife. Students prepare and present a summary of their findings and recommendations to the local Audubon Society, The Humane Society, neighborhood associations, and other interested groups. At the end of each public presentation, students gather public reaction to the data and collect ideas on how to reduce injury to wildlife. These recommendations are compiled into a newsletter and wiki for dissemination to a wider audience.
At a Glance
Grade Level: 6-8
Subject: Biology, Data Analysis
Topics: Ecology, Birds, Wildlife Diversity
Higher-Order Thinking Skills: Analysis, Evaluation, Investigation
Key Learnings: Data Organization, Representation and Analysis, Effects of Humans on the Ecosystem, Predator/Prey Relationships, Community Education and Outreach
Time Needed: 3 weeks (may be spread out over a longer period of time)
Things You Need
Assessment Plan (Appendix A)
Content Standards and Objectives (Appendix B)
Materials and Resources (Appendix C)
Mobile Learning
Mobile apps, reviewed by professional educators for related instructional content.
Android
Windows 8
Curriculum-Framing Questions
Essential Question:
How can I help protect urban wildlife?
Unit Questions:
How can we reduce the impact of modern society on urban wildlife?
How can statistics help us understand a problem?
What are some problems for wild animals that live in urban areas?
Content Questions:
What birds live in our community?
What are the greatest risks to these birds?
Assessment Processes
View how a variety of student-centered assessments (Appendix A) are used in the What Happened to Robin? Unit Plan. These assessments help students and teachers set goals; monitor student progress; provide feedback; assess thinking, processes, performances, and products; and reflect on learning throughout the learning cycle.
Instructional Procedures
Unit Preparation
Contact a local Audubon Society center to arrange a field trip to the center and to inquire about working together to develop a service project for the center. In the sample project, students sorted, organized, and analyzed five years worth of data on bird injury. This was a much needed service that the staff at the Wildlife Care Center did not have time to do.
Have students prepare science journals to take notes, make observations, and reflect on questions and discussions throughout the unit.
Introduction to Birds
Introduce the topic of birds to students by asking them to list the names of birds that are familiar to them. Provide time to learn about the birds in your area. This can be done over a period of time as students study local birds and learn how to identify them. Purchase local field guides to help with identification (available at local centers of the National Audubon Society).
Plan a birding outing to foster students' interest in birds and to develop their birding skills. Help students learn how to identify birds. Identification tips are available at birding.com. The Web site also has tips for planning a bird watching outing.
On the birding outing and over the course of the project, have students keep track of the birds that they identify. Bird checklists for the United States are available from the Audubon Society or online at the Northern Prairie Wildlife Research Center. After the designated time, have students graph their own data and compare with a partner. As an option, compile the class data. Discuss findings.
Urban Wildlife Issues
Ask students what they think are some urban wildlife issues. Ask the Unit Questions, What are some problems for wild animals that live in urban areas? and How can we reduce the impact of modern society on urban wildlife? Record responses on chart paper that has the tapping prior knowledge (Appendix D) questions and hold a class discussion.
Choose a local wildlife research project as a case study. For example, students in Portland, Oregon read about Portland's effort to make a home for its growing Peregrine Falcon population. This can be done in small groups, with each small group becoming an "expert team" on one case and sharing their knowledge with the other groups.
Next, pose the Essential Question, How can I help protect urban wildlife? and have students reflect individually in their journals. Allow students to share their thoughts in pairs. Ask for volunteers to share with the whole class.
Wildlife Injury
Discuss predator and prey relationships. Have students make predictions about what causes injuries to birds. Again, instruct students to become keen observers by noticing if/when birds become injured and how it happens. Have students keep a record in their journals.
Plan a visit to a Wildlife Care Center. Check with your local Audubon Society to locate a Wildlife Care Center in your area if available.
Present an overview of the project to the class with a descriptive brochure (Appendix K).
A field trip to a wildlife center should include a tour of the center to learn about its operations, explanations and discussion about wildlife injury, and hopefully, a visit with the birds there. The staff should explain the project that the students will be assisting them with and stress the importance of the students' work. Provide students with a handout (Appendix E) to take to the center to collect information during their visit. Collect injury records from the center to bring back to school. Upon returning to school, have students reflect on their experience, what made an impact on them, what they learned, and any new questions they have by recording their thoughts in their science journals.
Begin the next day by sharing journal entries and discussing any questions that arose from the field trip experience.
Data Analysis
Students are now prepared to investigate the Unit Question, How can statistics help us understand a problem? To begin, provide students with a copy of the wildlife injury spreadsheet directions (Appendix F). Use this document to help students learn how to use spreadsheet software to enter data and create graphs, charts, and tables if they have not used spreadsheet software before.
After the data is entered, students can make graphs, charts, and tables (Appendix J) to show an analysis of the results. Encourage students to focus on creating meaningful visual representations of the data that can be used to interpret the data and to educate others about injury to wildlife rather than become too focused on the appearance of the graphs, charts, and tables. Meet with students individually to answer questions and monitor progress.
With results in hand, students are ready to prepare slideshow presentations (Appendix H) that share their results and educate others about causes and prevention of wildlife injury. Hand out the project checklist (Appendix G) and presentation rubric (Appendix H), review expectations, and answer any questions. The presentations can be done in small groups with each student preparing a few slides. Each student should use the presentation checklist (Appendix G) to guide their progress and record feedback they receive from their peers after they practice their presentations.
Community Action
As a class, select audiences for small groups to present the data, educate others about injury to wildlife, and discuss ways to prevent injuries. This might include other students, The Humane Society, neighborhood associations, and other interested groups.
Instruct students to develop and practice speeches for presentation to the center and to other audiences. Have students use the peer feedback form(Appendix I) to assess their presentations, make modifications, and prepare properly. Each presenter should acquire feedback from at least one peer on the slides they present and on the presentation as a whole.
Have students create a newsletter (Appendix L). Review the newsletter checklist (Appendix M) with students and ask them to use it to help guide their work. Students can come up with article ideas related to their project work. Articles can be combined into a single newsletter, which can be handed out at public meetings and left at reception areas of local veterinary offices.
After presenting the data to different groups, students should get public reaction to the data and ask for input on how to reduce wildlife injuries. Explain that students should then relate findings to their hypotheses and write a report informing the Wildlife Care Center about the major causes of injuries to urban wildlife as well as the public's reaction and suggestions.
Finally, have students educate a broader audience by creating a wiki with recommendations for community action. They can also write press releases for the local newspaper.
Revisit the Essential Question
To complete the unit, have students reflect on the Essential Question, How can I help protect urban wildlife? again in their journals. Encourage students to look back at their initial responses and reflect on the direction the unit took them. Have them consider how the information and experiences they had have affected their initial thinking. Encourage discussion among class members to elaborate, share, and expand on their thinking.
Prerequisite Skills
Experience reading graphs and working with percentages
Knowledge of bird anatomy
Basic computer skills
Differentiated Instruction
Much of this work can be done at a variety of academic levels. As needed, partner students for computer work with technically skilled students.
Special Needs Student
Provide an alternate activity, such as:
Have the student develop a small book of bird case studies in which the student studies five species, includes a drawing or photo from the Web or a digital camera, and information about biology and habitat.
Have the student evaluate and describe the status of the birds locally using the data provided by the Audubon Wildlife Care Center.
Gifted/Talented Student
Require the student to write a scientific article on the results to be published in a scientific journal, coauthored with the director of the Wildlife Care Center.
Nonnative Speaker
Have the student study science vocabulary and practice oral presentations with an ELL assistant during supplemental instruction outside of class.
Pair the student with another student during project work when the language load indicates this, and have the student complete visual parts of the project independently (such as spreadsheets, graphs, and illustrations).
Shorten oral speaking activities or allow extra practice time.
Have the student prepare materials in the student's first language to educate others about wildlife injury.
Credits
Ginny Rosenberg Stern participated in the Intel® Teach Program, which resulted in this idea for a classroom project. A team of teachers expanded the plan into the example you see here.
Appendix A: Assessment Plan
Assessment Timeline:
Before unit work begins:
Questioning
Journals
Tapping Prior Knowledge Questions
Students work on unit and complete tasks:
Presentation Checklist
Presentation Rubric
Newsletter Checklist
Peer Feedback Form
Conferences
After unit work is complete:
Questioning
Presentation Rubric
Journals
Use questioning including the tapping prior knowledge (Appendix D) questions to gauge student needs before project work begins, and provide instruction as necessary. Students use a presentation checklist (Appendix G) and newsletter checklist (Appendix M) to help guide their learning, stay on track, and self-assess their progress. Quality of journal entries and research help both teacher and students to monitor progress and understanding of content. Questioning is used throughout the unit to help students develop their higher-order thinking skills and process content. Individual conferences are used to help monitor progress and answer any questions. Ask students to use the presentation checklist (Appendix H) and peer feedback form (Appendix I) to help them self- and peer assess work prior to completion. Use the same presentation rubric (Appendix H) to assess and grade the final project.
Appendix B: Content Standards and Objectives
Oregon State Standards
Science
Ask questions and form hypotheses that are based on observations and scientific concepts, and that can be explored through scientific investigations
Collect sufficient data to investigate a question, clarify information, and support an analysis.
Explain results and offer reasonable and accurate interpretations and implications
Identify and explain factors that influence or change the balance of populations in their environment
Describe and explain the effect of species, including humans, on an ecosystem
Math
Collect, organize, and interpret data
Create, interpret, and analyze charts, tables, and graphs to display data, draw conclusions, and solve problems
Evaluate and express statistical significance
Communication
Communicate ideas using oral, visual, written, and multimedia forms in ways appropriate to topic, context, audience, and purpose
Student Objectives
Students will be able to:
Evaluate the factors related to wildlife injury in an urban area
Collect public input and make recommendations for community action
Use spreadsheets to collect, sort, and display data
Create and deliver effective multimedia-enhanced speaking presentations
Create newsletters or wikis that summarize findings and recommend community action
Appendix C: Materials and Resources
Printed Materials
National Audubon Society. (1987). Pocket guide to familiar birds: Eastern region. New York: Alfred A. Knopf.
National Audubon Society. (1987). Pocket guide to familiar birds: Western region. New York: Alfred A. Knopf.
Robbins, C. S. (2001). Birds of North America: A guide to field identification. New York: St. Martin’s Press.
Salmansohn, P., & Kress, S. W. (2003). Saving birds—Heroes around the world. Gardiner, ME: Tilbury House.
Internet Resources
Websites
National Audubon Society
www.audubon.org
Access the National Audubon Society Web site to locate bird publications as well as find a local center near you in order to partner with them to develop a service-learning projectNorth Prairie Wildlife Research Center
www.npwrc.usgs.gov/
Bird checklists for your stateAudubon Society of Portland
http://audubonportland.org/issues/species/peregrine/
Article about Portland’s peregrines as well as other research projectsThayer Birding Software
www.thayerbirding.com
Multimedia CD-ROMs containing information about birds for each state
Technology—Hardware
Computers to research birds, input data, prepare graphs, and develop multimedia presentations
Printer to print results and brochures
Projection system to teach students how to use a spreadsheet program
Technology—Software
Spreadsheet software to conduct data analysis of wildlife injury
Multimedia software to develop presentations of results in order to educate the public about wildlife injury
Publishing application to create newsletters to educate others about wildlife injury and prevention
Appendix D: Tapping Prior Knowledge
What are some problems for wild animals that live in urban areas?
(sample responses)
Loss of habitat
Prey for cats and dogs
Fly into windows
Hit by cars or busses
Poisoned
Gunshot
Parents die
Drought
How can we reduce the impact of modern society on urban wildlife?
(sample responses)
Protect green spaces
Plant trees and bushes
Keep dogs and cats indoors
Don’t use pesticides
Educate people about not hurting animals
Drive cautiously
Throw trash away in containers
How can we go about finding the leading causes of injury to wildlife?
(sample responses)
Collect our own data by:
Surveying wildlife experts
Interviewing community members
Going to clinics and hospitals and asking for data they have collected
Find research others have done
Analyze all our data to look for causes
Appendix E: Wildlife Center Handout
IN THE WILDLIFE CARE CENTER:
How many types of birds are in the center today: ________
List 3 of the birds you see today, and write down how they got hurt:
Type (Species) of bird: | How it got hurt |
1. | |
2. | |
3. |
If a bird is attacked by a cat, its injuries are very serious. Why is this true?
Notes from the tour of the Wildlife Care Center
Appendix F: Wildlife Injury Spreadsheet Directions
Description: Use a spreadsheet to enter your wildlife injury data. Work in groups to
make charts that describe one feature of the data (injury rates for different months,
different species, survival rates, causes of injury, and so forth).
Step 1: Enter data into the spreadsheet.
Open a worksheet in spreadsheet software. In cell A1, type the title of your study (for
example, type Wildlife Injury). In row 2 beginning in cell B2, type the types of data you
gathered (for example, # of injuries, # of survivals, species, causes of injury, and so
forth). In column A, beginning in cell A3, list the months of the year. Enter your data in
columns B, C, D, and beyond to add data below your category headings.
Step 2: Create a formula in the Formula Bar.
Formulas can be used to calculate data in spreadsheets. To add a formula to a
spreadsheet, follow these steps:
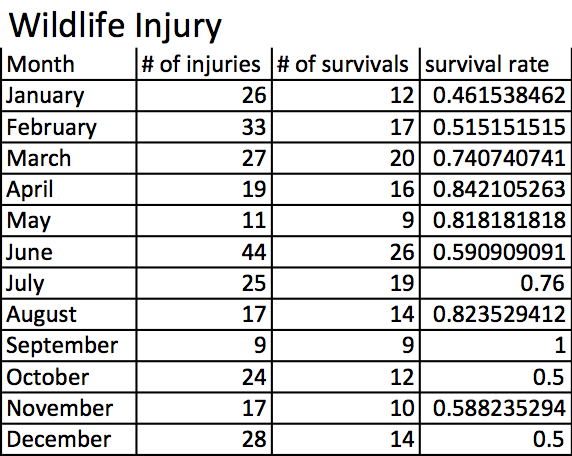
In a new column, type a column heading, such as survival rate as shown in the sample graphic above.
Click the cell under the new heading, next to the row of data you want to calculate.
Click in the Formula Bar, and type an equal sign (=) to begin your formula.
Determine which operation or formula you need to use to calculate your data. For example, to obtain the survival rate in the sample, the # of survivals should be divided by the # of injuries.
To create the formula, click the cell location that contains the first part of the equation, such as C3 in the sample, type the division sign (/), and then click the cell containing the second part of your equation, such as B3. The sample formula looks like =C3/B3. Press Enter. The formula calculates and then displays the results. Repeat this process for all rows you want to calculate, or copy and paste the formula into the appropriate cells.
Step 3: Choose and create graphs to represent your data.
To create a chart or graph:
Highlight the cells that you want to use to create a graph or chart.
Choose Chart on the Insert menu.
Choose the chart type that you think best represents your data (see the following examples), and then click Next.
Follow the directions for your type of chart, such as:
Add titles for the chart or graph and axes if appropriate.
Click the Gridlines tab and experiment with gridline options if gridlines apply to your type of chart. Choose gridlines that make understanding your data easier.
Click the Legend tab and choose a location for the legend.
Click Next.
Place the chart or graph as an object on the original worksheet, so that you can see the worksheet entries as you examine the object, or place the chart or graph in a separate sheet of your worksheet and label it. Have fun displaying your information—explore several types of charts and graphs to see which one best represents your data!
Appendix G: Presentation Checklist
Our presentation provides background information about the center we worked with, including:
▢ Purpose
▢ Location
Our presentation addresses a clearly stated research question that:
▢ Unifies the presentation
▢ Investigates an important issue about urban wildlife
▢ Includes a prediction
We explain where and how we gathered information by describing:
▢ Resources
▢ Processes
We analyze the question with data using:
▢ Charts
▢ Graphs
▢ Statistics
We draw conclusions about the data, and we:
▢ Attempt to answer the question based on data
▢ Explain how data can be used
(We answer the Essential Question, How can I help protect urban wildlife?)
Our presentation is engaging and:
▢ Appropriate for the audience
▢ Elicits feedback and ideas
My slides include:
▢ Appropriate amount of text on each slide
▢ Appropriate font size
▢ Meaningful graphics
▢ Meaningful animations
▢ Meaningful multimedia (such as music or video)
▢ Effective slide transitions
I practiced presenting my slides and giving the presentation to a group.
▢ Length of practiced presentation _________
List the useful comments you received from viewers of your practice presentation:
Describe how you revised your slides to make your presentation better:
Appendix H: Presentation Rubric
4 | 3 | 2 | 1 |
Content | |||
• Collects, organizes, and interprets data accurately and thoughtfully. • Understands and is able to clearly articulate several causes of wildlife injury. • Understands and is able to clearly articulate several preventative measures for wildlife injury. • Displays in-depth knowledge of bird injury. | • Collects, organizes, and interprets data Accurately. • Understands and is able to articulate a few causes of wildlife Injury. • Understands and is able to articulate some preventative measures for wildlife Injury. • Displays general knowledge of bird injury. | • Collects, organizes, and interprets data, with some mistakes and little Interpretation. • Understands and is able to articulate one or two causes of wildlife injury. • Understands and is able to articulate one or two preventative measures for wildlife Injury. • Displays some knowledge of bird injury. | • Collects data, but does not organize or interpret it in a clear Way. • Lacks understanding or is unable to articulate any causes of wildlife Injury. • Lacks understanding or is unable to articulate preventative measures for wildlife Injury. • Displays minimal knowledge of bird injury. |
Presentation | |||
• Explains results of data collection with knowledge and expertise, and offers reasonable and accurate interpretations and Implications. • Develops effective and appropriate visual representation of data—graph, chart, or table. • Presents in a manner that is extremely clear, focused, and well suited to the audience and purpose. • Includes main ideas that significantly draw the audience’s attention and are developed by strong and compelling supporting details. • Elicits feedback from an engaged and enthusiastic audience. | • Explains results of data collection with knowledge, and offers reasonable interpretations and Implications. • Develops appropriate visual representation of data—graph, chart, or table. • Presents in a manner that is generally clear, focused, and suited to the audience and Purpose. • Includes main ideas that draw the audience’s attention and are developed by clear supporting Details. • Elicits some feedback from an engaged audience. | • Explains results of data collection with basic knowledge, but offers little Interpretation. • Develops visual representation of data—graph, chart, or table. • Presents in a somewhat unclear manner that needs focus or could be better suited to the audience and Purpose. • Includes main ideas that are not clearly developed by supporting details. • Elicits very little feedback from an audience that does not seem engaged. | • Does not explain results of data collection or offers an unclear analysis. • Develops an incomplete visual representation— graph, chart, or table. Presents in an unclear manner. • Includes main ideas that are not clearly developed or are missing supporting Details. • Elicits no feedback from the audience. |
Organization and Mechanics | |||
• Organizes the presentation in a way that strongly enhances and develops the main Ideas. • Presents information in order, using a clear-cut structure that supports the audience’s understanding and encourages Involvement. • Uses a strong, creative introduction that brings the audience into the topic and creates a desire to hear more. • Shows evidence that details are carefully selected and strategically placed for optimum impact. • Matches the structure to the content and purpose of the presentation Effectively. • Includes no errors. | • Organizes the presentation in a way that consistently enhances and develops the main Ideas. • Presents information in order, using a structure that supports the audience’s understanding and encourages some Involvement. • Uses an introduction that brings the audience into the topic. • Shows evidence that details are placed for optimum impact. • Matches the structure to the content and purpose of the presentation. • Includes one or two errors that do not detract from the presentation. | • Organizes the presentation in a way that somewhat enhances the main Ideas. • Presents some of the information out of order or does not encourage audience Involvement. • Uses an introduction that does not to bring the audience into the topic or does not create a desire to hear more. • Shows evidence that some details are missing, or, if present, details are misplaced for optimum impact. • Matches the structure to the content and purpose of the presentation at times. • Includes some errors that detract from the presentation at times. | • Organizes the presentation in a way that does not enhance the main Ideas. • Presents information out of order, making the presentation difficult to understand. • Does not use an Introduction. • Shows evidence that details are Lacking. • Does not match the structure to the content and purpose of the presentation. • Includes many errors that make the presentation difficult to understand. |
Appendix I: Peer Feedback Form
Name of Presenter: _____________________ Name of Peer: ____________________
1. What were three good features about the presentation (such as content, pace, speaking skills, and so forth)?
2. What two changes would you recommend to the presenter to improve the presentation?
3. Was the hypothesis clearly stated? Describe the hypothesis as you understand it.
4. Was interpretation of the data visually represented and clearly explained? If not, what would make it clear? If it was clearly explained, describe your understanding.
5. Is the presentation appropriate for the audience? If not, what can be changed?
Appendix J: Graphs, Charts, and Tables
Wildlife Injury | |||
Month | # of injuries | # of survivals | survival rate |
January | 26 | 12 | 0.461538462 |
February | 33 | 17 | 0.515151515 |
March | 27 | 20 | 0.740740741 |
April | 19 | 16 | 0.842105263 |
May | 11 | 9 | 0.818181818 |
June | 44 | 26 | 0.590909091 |
July | 25 | 19 | 0.76 |
August | 17 | 14 | 0.823529412 |
September | 9 | 9 | 1 |
October | 24 | 12 | 0.5 |
November | 17 | 10 | 0.588235294 |
December | 28 | 14 | 0.5 |

Appendix K: Brochure
Sharing Our Information NEXT: We will write a report of our findings for the Portland Audubon Society. We will also: 1. Create a wiki that explains this data. Audubon will link their Web page to ours so people can learn about the results of our study. 2. Create a newsletter explaining our results. Each student will be in charge of a section. We will send this as a press release to our local newspapers. This eagle was killed by a power pole. What other ways do birds get injured? | Urban Eco System Project | Urban Eco System Project: Apply classroom learning to the community Community need: Portland Audubon Wildlife Care Center needs our help! The Situation: The Wildlife Care Center is a hospital for injured birds and wildlife. For the last 5 years, the center has collected data on what is hurting urban wildlife. When a bird or mammal enters the center, the cause of injury is recorded. The Problem: The problem is, the staff is too busy caring for the animals to analyze their data and find out the main reasons for these injuries. Look inside to see how our class will help the Wildlife Care Center! |

Our Solution: Since George Middle School Students study graphs and computers… Since we study birds and wildlife in science… Since we are trained as scientists to analyze data… We will: 1. Use the data Audubon has collected for the last 5 years, enter it on a spreadsheet, graph the information, and help the Wildlife Care Center find out what are the major causes of injuries to urban wildlife. 2. We will present our information to the center, and to other public audiences throughout Portland, Oregon. 3. We will get the public’s reaction to the data and ask them for their input on how we can help prevent these injuries. 4. We will return this public input to the Audubon Society and put it on a wiki site. We will also write a press release for The Oregonian Newspaper to help get information out to the community. | First Step:
Next:
Learn New Technology:
OUR GRAPHS WILL SHOW THE MAJOR REASONS URBAN WILDLIFE ARE INJURED AND KILLED. | Our class will create a multimedia presentation. We will go out to the public and share our results with them. You will: 1. Design one page of the multimedia presentation. 2. Prepare a speech based on the presentation. PUBLIC PRESENTATION Each student will be assigned to a public presentation. In this presentation, you will: 1. Share the class presentation that demonstrates our class project with the Wildlife Care Center. 2. Answer questions about the data and the Wildlife Care Center. 3. Work with the audience to brainstorm ideas as to what can be done about the things that injure urban wildlife. Examples of places where you can do your presentation: 1. Audubon Society monthly meeting 2. Neighborhood association meeting 3. School classrooms of your choice 4. A church group 5. The Oregon Humane Society 6. The Feral Cat Society monthly meeting You will learn:
Knowledge is the first step to making a difference in your world! |
Appendix L: Newsletter

Appendix M: Newsletter Checklist
Content:
▢ Our newsletter offers information about the resource we worked with, including their purpose and location.
▢ Our newsletter includes a main article and supporting articles that address our project work.
▢ We proofread and carefully craft our writing to make it interesting and relevant to the audience.
▢ Our newsletter highlights special points of interest related to our project.
▢ Our newsletter states statistics and includes data to educate others about injury to wildlife.
▢ We answer the Essential Question, How can I help protect urban wildlife?
▢ Our newsletter provides solutions or ways to prevent injuries.
▢ Our newsletter is appropriate for our targeted audience.
Organization and Appearance:
▢ We provide an appropriate balance of graphics and text on each page.
▢ We use spacing and margins to create a pleasing layout.
▢ We use appropriate font sizes, image sizes, colors, boxes, and lines to make each page’s design neat and attractive.
▢ We include appropriate graphics and text that emphasize the topics.
▢ We include the necessary newsletter components, including a table of contents.
▢ We include an eye-catching first page and title for our newsletter.
Appendix N: Terms of Use and License
Terms of Use
These resources provided by Intel Education are 'open' and are available for educational use. Many hold Creative Commons licenses that allow them to be repurposed, modified and adapted for a diverse array of local contexts.
Each resource has one of three conditions of use labels. These at-a-glance labels can help you quickly distinguish whether a resource can be changed or shared without further permission required. In addition, you can find the specific license or terms of permitted use for each resource.
Remix and Share Your remixing, redistributing, or making derivatives works comes with some restrictions, including how it is shared. Includes Creative Commons Attribution Share Alike (CC BY-SA), Creative Commons Attribution NonCommercial Share Alike (CC BY-NC-SA), Creative Commons Attribution NonCommercial (CC BY-NC), GNU Free Documentation License (GFDL);
Share Only Your redistributing comes with some restrictions. Do not remix or make derivative works. Includes Creative Commons No Derivatives (CC ND).
Read the Fine Print Everything else. All Rights Reserved. US-based educators have certain permissions under Fair Use and the TEACH Act. Includes educational and personal uses of copyrighted materials, custom licenses and terms, permission to print only, unknown restrictions, and any other redistribution restrictions of the DMCA and of your own country.
License
All Intel® Education Content is protected under U.S. and international copyrights. Intel Education owns and retains all rights, title and interest, including all rights under copyright, in and to all Intel Education Content. Your rights to use, share and adapt Intel Education Content under the Creative Commons (“CC”) License are merely those of a non-exclusive licensee, and you do not acquire copyright ownership with respect to any Intel Education Content.
Except as expressly otherwise noted, all Intel Education Content (including Intel Education Curriculum Material) is made available to Users in accordance with the Creative CommonsAttribution-Noncommercial 3.0 Unported (CC BY-NC) License (http://creativecommons.org/licenses/by-nc/3.0/), as amended and updated by Creative Commons from time to time (the “CC BY-NC License”), which is incorporated herein by this reference.
The CC BY-NC License allows you to freely share and adapt Intel Education Content, provided that:
You give proper attribution to Intel Education in the manner specified by Intel Education, but not in any way that suggests that Intel Education endorse you or your use;
You may not use, copy, reproduce, perform, display, distribute, transmit, disseminate, modify, adapt, create derivative works from, or otherwise exploit Intel Education Content for commercial purposes, including for commercial advantage or private monetary compensation;
For any reuse or distribution of Intel Education Content, you must make clear to others the CC BY-NC License terms (the best way to do this is with a link to http://creativecommons.org/licenses/by-nc/3.0/); and,
You comply with all other requirements as may be specified in the CC BY-NC License. The CC BY-NC license supersedes and replaces any Creative Commons license previously adopted by Intel Education for Intel Education Content.
NOTE: Notwithstanding the above, the CC BY-NC License does not apply to photos, images and other materials contained in Intel Education Content which have been licensed by Intel Education from Shutterstock.com and/or other commercial stock photo/image agencies (you can easily identify such a photo or image by looking at the credit embedded within or associated with the photo or image) (each, a “Licensed Stock Photo”). You are allowed to retain a copy of a Licensed Stock Photo for your own personal, non-commercial use only, BUT (i) you may not modify, alter, adapt, or otherwise create any derivative work from a Licensed Stock Photo and (ii) you may not distribute, transmit or disseminate a Licensed Stock Photo or any copy or derivative work thereof, to any third party, whether by itself, as part of Intel Education Content, as part of your Curriculum Contributions, or otherwise.
If you wish to use Intel Education Content for commercial purposes, you must contact Intel Education to enter into a separate license agreement governing commercial use of the Intel Education Content.
If you do not agree to the terms of the CC BY-NC License, please refrain from using Intel Education Content in any manner, including downloading, copying, reproducing, printing, editing, modifying, distributing or transmitting such content, in any media or by any means, whether now known or hereafter developed. If you accept the terms of the CC BY-NC License and proceed to use any Intel Education Content, then any breach or violation by you of the CC BY-NC License will automatically constitute a violation of the TOU and may subject you to liability to Intel Education for copyright infringement. Also, to the extent you have violated the CC BY-NC License and made modifications or improvements to, or have prepared derivative works based upon, Intel Education Content or have otherwise incorporated Intel Education Content into your own content for commercial purposes, your violation of the CC BY-NC License will automatically subject such modifications, improvements or derivative works by you, or your own content that is mixed with Intel Education Content, to a perpetual, royalty-free, worldwide license to Intel Education, and Intel Education may, in its sole discretion, elect to exercise the foregoing license in addition to or without prejudice to any other remedies available.