Red Light, Green Light
Unit Plan
Unit Summary
After a car and pedestrian accident occurs near the local school, concerned students, parents, and neighbors launch a neighborhood safety project. Students consider potential hazards and then collect traffic and pedestrian data that might shed light on the situation. A survey is conducted to determine how children in the neighborhood travel between home and school, and students challenge their classmates to increase their use of human-powered (foot and pedal) transportation. Students use spreadsheets to enter and represent data, analyze their observations and survey data to determine the most significant problems, and study possible solutions. They develop a proposal for improving traffic safety, create slideshows and brochures, and present their ideas to the local city council.
At a Glance
Grade Level: 3-5
Subjects: Social Studies, Science, Math, Technology
Topics: Safety, Government, Geography
Higher-Order Thinking Skills: Data Analysis, Data Interpretation
Key Learnings: Data Collection, Organization and Analysis, Persuasive Speaking
Time Needed: 10-12 weeks: 1 period daily during the first week, then 2 or 3 periods each week thereafter
Things You Need
Unit Assessment Plan (Appendix A)
Unit Standards (Appendix B)
Unit Materials and Resources (Appendix C)
Mobile Learning
Mobile apps, reviewed by professional educators for related instructional content.
Android
iOS
Windows 8
Curriculum-Framing Questions
Essential Question
How can we communicate so we will be heard and understood?Unit Questions
How safe is our school neighborhood?
How can we improve the safety of our school neighborhood?Content Questions
What factors influence street safety?
How do decisions get made in our community?
What safety measures are in place in our neighborhood?
Assessment Processes
View how a variety of student-centered assessments (Appendix A) are used in the Red Light, Green Light Unit Plan. These assessments help students and teachers set goals; monitor student progress; provide feedback; assess thinking, processes, performances, and products; and reflect on learning throughout the learning cycle.
Instructional Procedures
Consider the Problem
Begin this project by introducing a scenario involving an accident that occurred near the school. Hold a discussion with the class and ask them to consider the following questions:
Could the accident have been avoided? If so, how?
What other hazards should we be aware of?
What measures are already in place to help prevent accidents and alert drivers and pedestrians?
Record ideas and answers on a piece of chart paper. Use student contributions to determine students' prior knowledge about safety and the kinds of evidence they use to support their opinions.
After discussing solutions and recording ideas, pose the Essential Question, How can we communicate so we will be heard and understood? Engage students in a Think-Pair-Share to brainstorm ideas. Take observational anecdotal notes as students share their thoughts to provide ideas for areas to address during instruction.
Go for a walk in the neighborhood, and take copies of a map of the immediate area. Ask students to think about the question, How safe is our school neighborhood? Have students label safety measures they recognize on their maps. (Keep the maps; students will repeat this activity after instruction.)
Have students meet with members of the parent-teacher association or local school advisory committee to discuss their concerns about safety and to ask for their help when it is time to collect data in the neighborhood. If possible, invite a transportation specialist to discuss the topic. The Federal Highway Administration website can guide you as you help students plan the safety investigation.
Pedestrian and Bicycle Safety
Students are at least partially at fault in 70 percent of accidents in school zones. Ask students to write in their journals about how they stay safe when they walk and ride their bikes around the neighborhood. Use this information to plan basic lessons students need related to street safety for pedestrians and bicyclists. Local public safety departments often provide useful lesson plan suggestions and materials.
Citizens Respond
Discuss the ways citizens can have an impact on their community through elections, citizen advisory boards, volunteer campaigns, and public hearings. Ask students what they might do to make their neighborhood safer for pedestrians and bicyclists, and then propose the idea of a street safety study. (Note: Some cities have research packets citizens can use to monitor traffic and street safety in their neighborhood.) Before the study is designed and implemented, determine the audience for the resulting proposal. Challenge students to find out how decisions related to traffic and street safety are made. They can ask parents, make phone calls, look in a city directory, or check the government agency index in the phone book. Depending on the locale, a city council, county commissioner, city manager, or transportation administrator may be the appropriate party to contact. Another audience is the school student body, parents, and neighbors who are also responsible for street safety.
Design the Study
Set small student groups to work considering the following question set:
What is one possible cause of unsafe streets?
Given this possible cause, what should we look for?
What should we count or measure?
For example:
Possible cause? Pedestrians cross streets at places other than marked crosswalks.
What to look for? Pedestrians crossing streets outside of crosswalks.
What to count or measure? The number of pedestrians who use crosswalks and the number of pedestrians who don't.
Groups may ask and answer the set of questions repeatedly for each safety concern they have. After ideas are generated, have teams present their ideas and discuss their reasoning. Elaborate on the best ideas, and offer ideas that were not raised. (Note: The most common problems in school zones are excessive speeding; general traffic volume; congestion at peak hours when buses, cars, bicycles, and pedestrians share space; and unsafe pedestrian and bicyclist practices.) From these ideas, make a recording tool, such as this street safety research sheet (Appendix D) to collect information.
Observe, Measure, and Count
Divide the questions among groups of three or four and arrange for observations in the neighborhood for several days during peak congestion periods, such as before and after school, and following sports practice or games. Help teams gather necessary items for the observations, such as data sheets, clipboards, golf counters, measuring tapes, and digital cameras. If possible, borrow a speed gun from the high school baseball team or local traffic or public safety department. Station adult volunteers with each group at crosswalks and other points where data will be collected.
In addition to studying the situation outdoors, help students create a family survey (Appendix E) to determine how kids travel between home and school. Include a question about how far each family lives from school as well. Distribute the take-home survey to all classrooms. Ask students to use the data rubric (Appendix F) to self-assess their data collection and record-keeping.
Organize and Summarize Data using a Spreadsheet
Demonstrate ways research results can be more easily understood through charts and graphs. Demonstrate two traffic charts (Appendix G) of traffic volume, and discuss their interpretation. Discuss what they show as well as what they do not show.
Introduce students to the spreadsheet as a tool for organizing, representing, and analyzing their traffic studies and family survey data. Using a projector, provide students with a spreadsheet tour. Show them how to:
Create a new worksheet
Add a title
Enter headings and data
Create charts
Provide students with a copy of the spreadsheet worksheet (Appendix H) to aid them in creating their own spreadsheets, charts, and graphs using data collected from their traffic studies and family surveys. When the charts and graphs are complete, have students practice interpreting their charts and graphs with one another.
Draw Conclusions
Guide students in the next phase as they draw conclusions from the data. Some data will be interesting but not lead to conclusions about safety or, subsequently, to a proposal. Ask students to self-assess their data interpretation with the data rubric (Appendix F). Record conclusions on posters, and include the data and charts that support the conclusions.
Introduce students to traffic-calming devices as one method for improving safety. Pass out pictures of different devices and have small groups consider the purpose of each. When they return to the large group, explain the actual names and functions of the devices.
Have the class take another walk around the school neighborhood with their maps to see what safety measures students recognize after instruction. These may include signs showing speed limits, pedestrian zones, and parking regulations; yellow paint marking no-parking zones; calming devices, such as speed bumps and street narrowing; lighting at intersections; clear crosswalk zones; and so on. Create a large-scale map with all the traffic features labeled. Based on class discussion, add suggested changes to the map in a different color.
Plan a Proposal
Pose the Unit Question, How can we improve the safety of our school neighborhood? Discuss practical solutions to the safety problems the class has identified. These may include greater speed limit enforcement; reduced vehicle congestion through more walking, bicycling, and carpooling; improved signage and lighting in the neighborhood; crosswalk monitors; traffic-calming devices; rerouted traffic; car-free zones at certain hours; a new parking or drop-off plan; and staggered arrival and departure times.
Set groups to work writing a one-page paper detailing a specific aspect of the project. Each group's paper should include answers to the Essential, Unit, and Content Questions. Ask students to refer to the data rubric (Appendix F) as they write their paper. The paper should also include the following elements:
One research question
Data collection methods
Summary of the data with graphics
Conclusions
Proposal for improved safety
Have groups present their reports to others for discussion and feedback before they submit them as part of the greater class proposal.
Persuade Your Audience
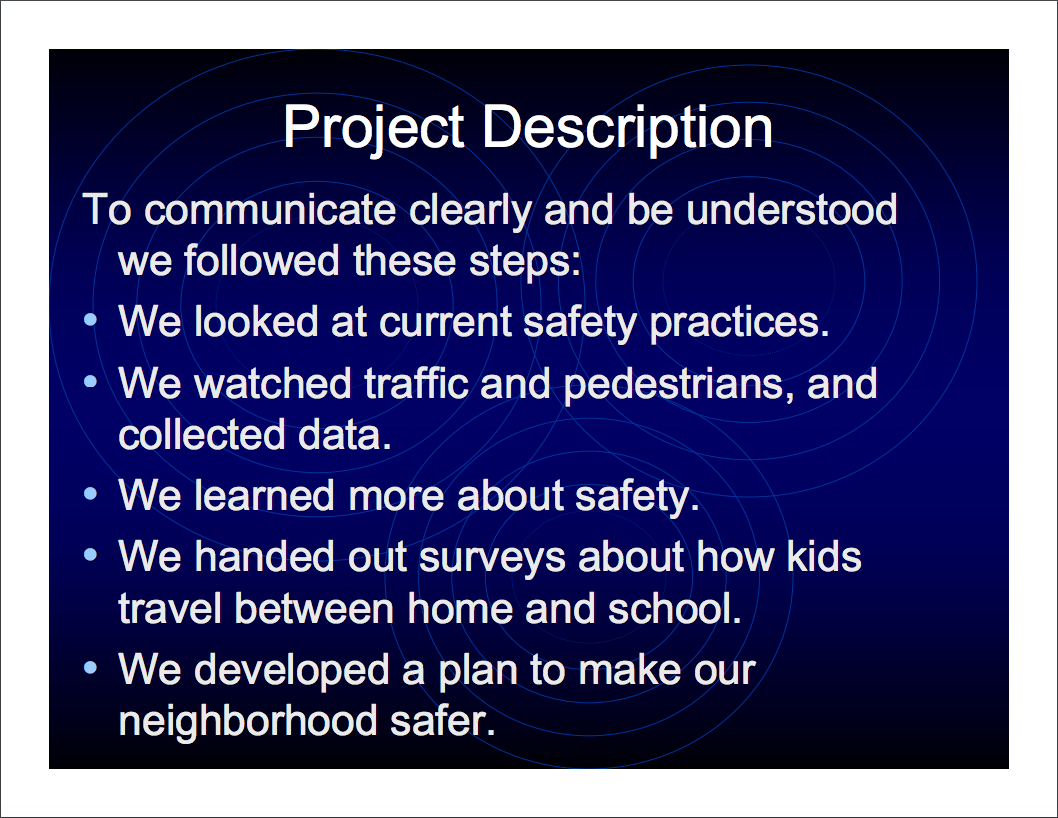
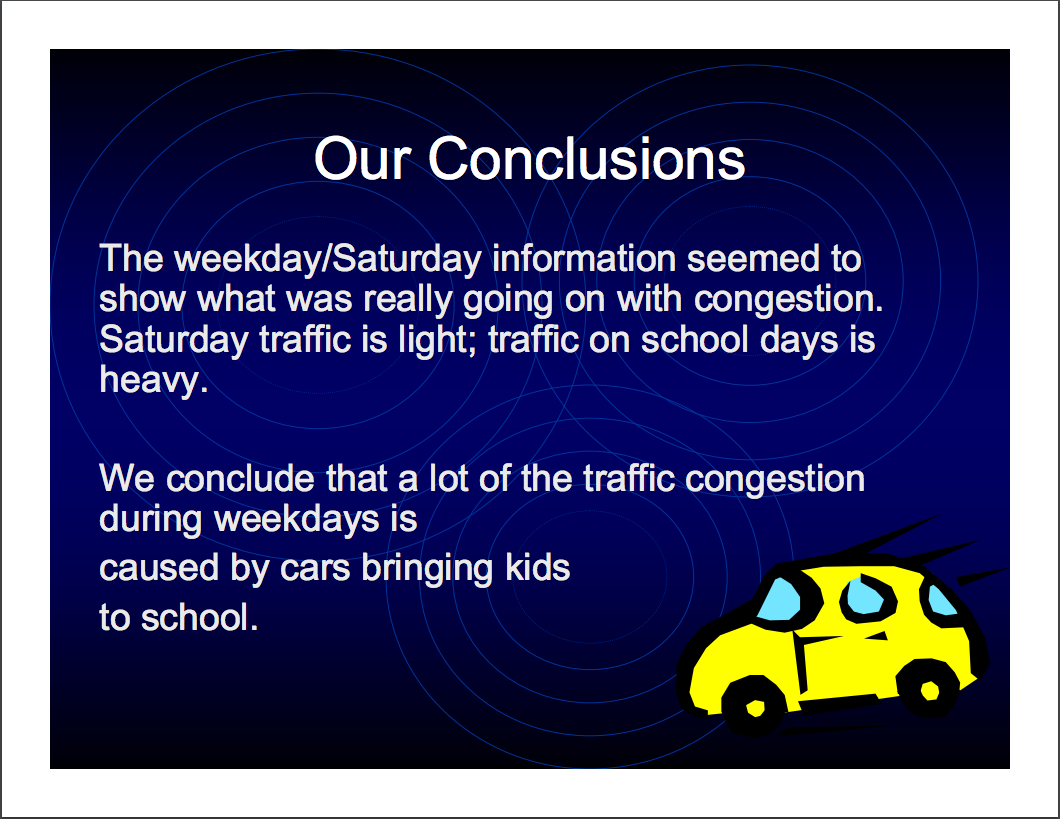
Pose the Essential Question again, How can we communicate so we will be heard and understood? Ask students to consider whether they have answered this question and how they will address it in a slideshow presentation. Have student groups summarize their efforts in several multimedia slides using information from their reports and the presentation checklist (Appendix I) to guide their work. Combine each set of slides into a larger presentation for students and parents, or for the city council or other responsible governmental body. View an example of one team's work (Appendix J).
Let Others Know
To enhance awareness of traffic safety for the school community and neighborhood, have students create brochures alerting people to potential hazards and reminding them of the safety rules for vehicles and pedestrians. The brochure might present a school-wide challenge where students track their human-powered mileage between home and school, and try for month-to-month improvement. A brochure checklist (Appendix K) may be used as a student guide. Send the brochures (Appendix L) home to share with parents. Distribute them to local businesses, and at community and school meetings.
Show What You Know
Use the rubrics in the assessment section to assess student products and participation. Additionally, you may want to assess student learning by asking them to write about the unique question, What steps could you take if graffiti was a problem at the park near your house? Encourage students to reflect on what they learned in the unit by analyzing their conclusions to the following Unit and Content Questions:
How safe is our school neighborhood?
How can we improve the safety of our school neighborhood?
How do decisions get made in our community?
What safety measures are in place in our neighborhood?
Finally, have students respond in their journals to the Essential Question, How can we communicate so we will be heard and understood? in relation to this new situational question.
Prerequisite Skills
Students may need mini-lessons on spreadsheet and multimedia use.
Prior experience with word processing, file management, and Internet researching is helpful.
Differentiated Instruction
Resource Student
Provide additional adult assistance
Allow extra work time
Make task modifications as needed
Gifted Student
Have the student serve as an expert in areas such as reading, writing, and technology use
Encourage the student to create a class Web site to highlight key learnings, student work, observations, charts, solutions, interviews, and other relevant information
English Language Learner
Ask the ELL teacher to support instruction
Ask the ELL teacher to help students translate basic terms into an English/first language glossary, explain difficult concepts, and help the student complete assignments and conduct research
Pair the student with other common first language speakers who have greater English proficiency for tasks that require reading and writing
Adapt assignments
Allow more time as necessary
Credits
A teacher participating in the Intel® Teach Program developed this idea for a classroom project. A team of teachers expanded the plan into the example you see here.
Appendix
Appendix A: Unit Assessment Plan
Conduct a whole-class discussion on safety around the school to determine students’ prior knowledge on the subject and also to ascertain how students use data to form their opinions. Take anecdotal observations while students share their ideas about the Essential Question with a partner to determine areas to address in future instruction. Collect data about individual students’ thoughts about bicycle and pedestrian safety from a journal entry completed during the beginning phase of the unit.
While students plan, carry out their data collection, and interpret their results, have them use the data rubric (Appendix F) to self-assess their processes. As students create their presentations, ask them to use the presentation checklist (Appendix I) to manage their time and make sure they have met all the requirements. Have students use the presentation rubric(Appendix M) to ensure that their work meets the expected quality standards. When students create brochures to inform the community about safety issues, they use the brochure checklist (Appendix K) to monitor their work.
When the presentation is in its final form, use the presentation rubric (Appendix M) to assess the quality of the project. Finally, ask students to summarize their learning in their journals to determine what important topics need to be dealt with in future units.
Appendix B: Unit Standards
Targeted Oregon Content Standards and Benchmarks
Social Sciences: Geography (Benchmark 2, Grade 5)
Define basic geography vocabulary such as concepts of location, direction, distance, scale, movement, and region using appropriate words and diagrams
Know and use basic map elements to answer geographic questions or display geographic information
Examine and understand how to prepare maps, charts, and other visual representations to locate places and interpret geographic information
Understand how physical environments are affected by human activities
Social Sciences: Civics and Government (Benchmark 2, Grade 5)
Understand how citizens can learn about public issues
Identify and give examples of how individuals can influence the actions of government
Social Sciences: Analysis (Benchmark 2, Grade 5)
Examine an event, issue, or problem through inquiry and research
Gather, use, and document information from multiple sources (such as print, electronic, human, primary, secondary)
Math: Statistics and Probability (Benchmark 2, Grade 5)
Collect, organize, display, and analyze data using number lines, bar graphs, line graphs, circle graphs, stem and leaf plots, and histograms
Formulate and carry out simple experiments and simulations. Collect and analyze data using measures of central tendency
Make predictions using experimental probability
Express probabilities using fractions, ratios, and decimals
National Educational Technology Standards (NETS)
Performance Indicators for Technology Literate Students (Grades 3-5)
Prior to completion of grade 5, students will:
Use technology tools (such as multimedia authoring, presentation, Web tools, digital cameras, scanners) for individual and collaborative writing, communication, and publishing activities to create knowledge products for audiences inside and outside the classroom
Determine which technology is useful and select the appropriate tool(s) and technology resources to address a variety of tasks and problems
Use technology resources (such as calculators, data collection probes, videos, educational software) for problem solving, self-directed learning, and extended learning activities
Student Objectives
Students will be able to:
Learn how communities make decisions
Gather data to identify traffic issues and problems in the neighborhood
Explore cause and effect
Formulate questions
Collect and organize information from multiple sources
Classify information, analyze data, and evaluate when data is relevant to a problem
Summarize findings, reach conclusions, and make decisions based on visual displays of data
Propose a solution to the problem and present the proposal in an effective way
Appendix C: Unit Materials and Resources
Internet Resources
National Geographic Map Maker Interactive
http://mapmaker.nationalgeographic.org/
National Geographic’s offering of an online interactive atlasPortland Transportation Traffic Calming Site
https://www.portlandoregon.gov/transportation/35934
City of Portland’s description of its Traffic Calming Programs along with descriptions of other safety devicesFederal Highway Administration
http://safety.fhwa.dot.gov/hsip/tsp/
Links to traffic programs in several cities and counties
Technology—Hardware
Computer(s) for conducting research and creating projects and presentations
Digital camera for taking pictures of neighborhoods for presentations and brochures
Internet connection for conducting research and creating presentations
Printer for printing documents
Projection system for lessons
Scanner to scan images for student presentations
Stopwatches for traffic observations
Technology—Software
Database or spreadsheet for collecting and charting data gathered from traffic observations
Desktop publishing for creating documents and presentations about traffic safety
Email for gathering information from city council members and other officials regarding how decisions are made in the community
Image processing for processing digital pictures for presentations and downloading Web sites
Internet Web browser for accessing the Internet for researching and instructional lessons
Multimedia for presentations about safety issues
Word processing for creating informational documents for presentations and daily assignments
Appendix D: Street Safety Research Example
Street safety concern? Too much traffic near school
What will you look for? The cars that pass by the front of our school and the ones that stop.
What will you count or measure? We will tally the number of cars that pass by the front of the school and make an x to mark every five minutes. We will count how many stop near the school, too.
Names: Jamie, Mark, Sean, and parent helper Date: April 7, 2002
Start Time: 7:45 a.m.
End Time: 8:20 a.m. (35 minutes)
Location: Intersection, SE 66th and Foster Road

Appendix E: Family Survey Example

Please have your parents answer these questions:
How far do you live from school? (Please tell the answer in miles or blocks) __________
Is this within walking or biking distance? YES NO
Does a school bus serve your neighborhood? YES NO
Please describe how your family makes choices about how children travel between home and school.
Can you think of ways to reduce vehicle congestion around our school to improve safety? Please describe:
Appendix F: Data Rubric
4 | 3 | 2 | 1 |
Data Collection | |||
We collected extensive data from multiple sources over several days that directly relates to our research question of traffic issues in our neighborhood. | We collected data over several days that directly relates to our research question. | We collected data, but some of it may not relate to our research question, and there may not be enough to draw any meaningful conclusions. | We collected very little relevant data. |
Data Records | |||
Our data records are neat and thorough. They are organized and labeled so they can be easily understood by anyone. | Our data records are neat and organized so we can understand them. | Our data records are rather messy and somewhat confusing. | Our data records are so messy that we can not understand them. |
Data Analysis | |||
We effectively used matching, classification, error analysis, generalizing, and specifying to find significant patterns in our data. We created a variety of visual displays to help us identify patterns and trends in our data. | We used appropriate strategies to find patterns in our data. Our visual display helped us find patterns in our data. | We rushed to finding patterns without using effective strategies or visual displays. | We did not find patterns in our data or the patterns we identified did not match the data. |
Data Interpretation | |||
We made predictions and determined cause and effect from our data. Our conclusions take into account all the relevant information we have found. | We drew some reasonable conclusions about causes and effects. | With help, we drew some conclusions from our data, but our conclusions may not take into account all the relevant data. | We did not draw any conclusions from our data, or the conclusions we drew do not follow logically from the information we collected. |
Appendix G: Traffic Chart Examples

Appendix H: Spreadsheet Worksheet
Spreadsheet Instructions
Description: Using your traffic studies and family surveys, create spreadsheets to enter your data and then make charts to analyze your data. Create one spreadsheet per group for your traffic study and individual spreadsheets for you family surveys.
Step 1
Open a worksheet in spreadsheet software. In cell A1, type the title of your study (for example, enter Street Safety). To make your title go across several columns, highlight the cells you want it to cover, click the Format menu, choose Cells, and click the Alignment tab. In the Text control section, select the Merge cells check box. You can now center your title and change the font size and style. You may even want to change the cell’s background fill color.
In row 3 beginning in cell A3, type the areas that you studied and measured or counted (for example, street corners, pedestrians using crosswalks, and pedestrians not using crosswalks). In column A, beginning in cell A4, list the places that you gathered your data, such as street corners. Enter your data (what you counted) in columns B and C.

Step 2
To create a chart or graph:
Highlight the data cells without highlighting the title.
Choose Chart on the Insert menu.
Choose the chart type that you think best represents your data, and then click Next.
Follow the directions for your type of chart, such as:
Add titles for the chart and its axes if appropriate.
Click the Gridlines tab and experiment with gridline options if grid lines apply to your type of chart. Choose grid lines that make understanding your data easier.
Click the Legend tab and choose a location for the legend.
Click Next.
Place the chart or graph as an object on the original worksheet, so that you can see the worksheet entries as you examine the object, or place the chart or graph in a separate sheet of your worksheet and label it.
Explore several options of charts to see which one best represents your data.
Step 3
Now create a spreadsheet (including charts) using your family survey data.
Appendix I: Presentation Checklist
Our Names: __________________________________________________________
Written Content
We used a storyboard to organize our thoughts.
We have a title slide that clearly states our topic.
We included the names of everyone in our group.
Information is correct.
Sources are cited.
We have listened to suggestions from the teacher or a friend.
We addressed the essential and unit questions.
Layout and Design
The words on our slides are easy to read.
Graphics enhance our presentation and are easy to see.
Pictures have captions.
We have animation effects that enhance the presentation.
The presentation contains all the necessary transitions for the viewer to navigate through the presentation. All transitions work properly.
There is enough time to read and see everything on the slides.
Mechanics
There are no mistakes in mechanics.
Words are spelled correctly.
Resources
We used books, magazines, or the computer to find information.
We looked at maps and drawings to find information.
We made a list of things we planned to use in the project.
Technology
We each took turns navigating on the computer (using the mouse, typing, inserting graphics and photos, and so forth).
We were able to do research on the Internet using the online encyclopedia and visiting recommended Web sites.
We have all practiced presenting our project using eye contact and expressive voices.
We remembered to save our work to the desktop folder.
Appendix J: Presentation Example


Appendix K: Brochure Checklist
Our Names: ________________________________________________________________
Written Content
We have a title page that clearly states our topic.
We included the names of everyone in our group.
We used a template to organize our thoughts.
Our information is correct.
Sources are cited.
We have listened to suggestions from the teacher or a friend.
We addressed the essential and unit questions.
Layout and Design of Brochure
The brochure is easy to read.
Graphics help readers understand the story.
Pictures have captions.
Mechanics
There are no mistakes in mechanics.
Words are spelled correctly.
Resources
We used books, magazines, or the computer to find information.
We looked at maps and drawings to find information.
We made a list of things we planned to use in the project.
Technology
We each took turns navigating on the computer (using the mouse, typing, inserting graphics and photos, and so forth).
We were able to do research on the Internet using the online encyclopedia and visiting recommended Web sites.
We remembered to save our work to the desktop folder.
Appendix L: Brochure Example

Appendix M: Presentation Rubric
4 | 3 | 2 | 1 | |
Content | We propose a practical, cost-effective, and logical solution to the problem and communicate our proposal in a persuasive way using graphs and charts of our data to support our idea. | We propose a reasonable solution to the problem and communicate our proposal effectively using charts and graphs of our data to support our idea. | We propose a solution, but it may not be practical, and we only partially support our idea with charts and graphs of our data. | We do not propose a solution, or the solution we propose is not reasonable and we have little or no data to support it. |
Organization | Our presentation is organized in a logical order with an introductory and closing slide. | Our presentation is organized and has an opening and closing slide. | Our presentation is in a rather confusing order or is missing an introductory or closing slide. | Our presentation is unorganized and difficult to follow. |
Appearance | We use an appropriate amount of text on a slide, and our slide design, along with graphics, transitions, and special effects, helps us communicate our meaning. | We use an appropriate amount of text on a slide, and our slide design, along with graphics, transitions, and special effects, do not detract from our meaning. | We sometimes put too much text on a slide, and our slide design, graphics, transitions, and special effects sometimes detract from our meaning. | We often put too much text on a slide, and our slide design, graphics, transitions, and special effects often overpower what we are trying to say. |
Writing Conventions | We have no errors in spelling, punctuation, capitalization, or word usage. | We have no errors in spelling, punctuation, capitalization, or word usage that detract from our meaning. | We have a few errors in spelling, punctuation, capitalization, or word usage that detract from our meaning. | We have so many errors in spelling, punctuation, capitalization, and word usage that our meaning is not clear. |
Appendix N: Terms of Use and License
Terms of Use
These resources provided by Intel Education are 'open' and are available for educational use. Many hold Creative Commons licenses that allow them to be repurposed, modified and adapted for a diverse array of local contexts.
Each resource has one of three conditions of use labels. These at-a-glance labels can help you quickly distinguish whether a resource can be changed or shared without further permission required. In addition, you can find the specific license or terms of permitted use for each resource.
Remix and Share Your remixing, redistributing, or making derivatives works comes with some restrictions, including how it is shared. Includes Creative Commons Attribution Share Alike (CC BY-SA), Creative Commons Attribution NonCommercial Share Alike (CC BY-NC-SA), Creative Commons Attribution NonCommercial (CC BY-NC), GNU Free Documentation License (GFDL);
Share Only Your redistributing comes with some restrictions. Do not remix or make derivative works. Includes Creative Commons No Derivatives (CC ND).
Read the Fine Print Everything else. All Rights Reserved. US-based educators have certain permissions under Fair Use and the TEACH Act. Includes educational and personal uses of copyrighted materials, custom licenses and terms, permission to print only, unknown restrictions, and any other redistribution restrictions of the DMCA and of your own country.
License
All Intel® Education Content is protected under U.S. and international copyrights. Intel Education owns and retains all rights, title and interest, including all rights under copyright, in and to all Intel Education Content. Your rights to use, share and adapt Intel Education Content under the Creative Commons (“CC”) License are merely those of a non-exclusive licensee, and you do not acquire copyright ownership with respect to any Intel Education Content.
Except as expressly otherwise noted, all Intel Education Content (including Intel Education Curriculum Material) is made available to Users in accordance with the Creative CommonsAttribution-Noncommercial 3.0 Unported (CC BY-NC) License (http://creativecommons.org/licenses/by-nc/3.0/), as amended and updated by Creative Commons from time to time (the “CC BY-NC License”), which is incorporated herein by this reference.
The CC BY-NC License allows you to freely share and adapt Intel Education Content, provided that:
You give proper attribution to Intel Education in the manner specified by Intel Education, but not in any way that suggests that Intel Education endorse you or your use;
You may not use, copy, reproduce, perform, display, distribute, transmit, disseminate, modify, adapt, create derivative works from, or otherwise exploit Intel Education Content for commercial purposes, including for commercial advantage or private monetary compensation;
For any reuse or distribution of Intel Education Content, you must make clear to others the CC BY-NC License terms (the best way to do this is with a link to http://creativecommons.org/licenses/by-nc/3.0/); and,
You comply with all other requirements as may be specified in the CC BY-NC License. The CC BY-NC license supersedes and replaces any Creative Commons license previously adopted by Intel Education for Intel Education Content.
NOTE: Notwithstanding the above, the CC BY-NC License does not apply to photos, images and other materials contained in Intel Education Content which have been licensed by Intel Education from Shutterstock.com and/or other commercial stock photo/image agencies (you can easily identify such a photo or image by looking at the credit embedded within or associated with the photo or image) (each, a “Licensed Stock Photo”). You are allowed to retain a copy of a Licensed Stock Photo for your own personal, non-commercial use only, BUT (i) you may not modify, alter, adapt, or otherwise create any derivative work from a Licensed Stock Photo and (ii) you may not distribute, transmit or disseminate a Licensed Stock Photo or any copy or derivative work thereof, to any third party, whether by itself, as part of Intel Education Content, as part of your Curriculum Contributions, or otherwise.
If you wish to use Intel Education Content for commercial purposes, you must contact Intel Education to enter into a separate license agreement governing commercial use of the Intel Education Content.
If you do not agree to the terms of the CC BY-NC License, please refrain from using Intel Education Content in any manner, including downloading, copying, reproducing, printing, editing, modifying, distributing or transmitting such content, in any media or by any means, whether now known or hereafter developed. If you accept the terms of the CC BY-NC License and proceed to use any Intel Education Content, then any breach or violation by you of the CC BY-NC License will automatically constitute a violation of the TOU and may subject you to liability to Intel Education for copyright infringement. Also, to the extent you have violated the CC BY-NC License and made modifications or improvements to, or have prepared derivative works based upon, Intel Education Content or have otherwise incorporated Intel Education Content into your own content for commercial purposes, your violation of the CC BY-NC License will automatically subject such modifications, improvements or derivative works by you, or your own content that is mixed with Intel Education Content, to a perpetual, royalty-free, worldwide license to Intel Education, and Intel Education may, in its sole discretion, elect to exercise the foregoing license in addition to or without prejudice to any other remedies available.