WP.2.3: STANDARD DEVIATION PROBLEMS
[WP.2.3]
WHITE PAPER TOPIC: STANDARD DEVIATION PROBLEMS
I. ADDITIONAL EXERCISES – POPULATION & SAMPLE STANDARD DEVIATION PROBLEMS
Use the following equations to solve for the standard deviation:
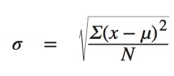
Population Standard Deviation Formula
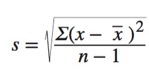
Sample Standard Deviation Formula
[Mechanics] Problem 1:
|
For this set of Population Data: |
|
|
20 |
|
|
40 |
|
|
50 |
|
|
60 |
|
|
80 |
|
[Mechanics] Problem 2:
|
For this set of Population Data: |
|
|
36 |
|
|
42 |
|
|
12 |
|
|
10 |
|
|
20 |
|
[Mechanics] Problem 3:
|
For this set of Population Data: |
|
|
3.25 |
|
|
4.25 |
|
|
6.75 |
|
|
5.5 |
|
[Mechanics] Problem 4:
|
For this set of Population Data: |
|
|
-4 |
|
|
0 |
|
|
2 |
|
|
-8 |
|
|
10 |
|
[Mechanics] Problem 5:
|
For this set of Population Data: |
|
|
16 |
|
|
20 |
|
|
-3 |
|
|
6 |
|
[Mechanics] Problem 6:
|
For this set of Sample Data: |
|
|
20 |
|
|
40 |
|
|
50 |
|
|
60 |
|
|
80 |
|
[Mechanics] Problem 7:
|
For this set of Sample Data: |
|
|
0 |
|
|
-4 |
|
|
2 |
|
|
8 |
|
|
17 |
|
[Mechanics] Problem 8:
|
For this set of Sample Data: |
|
|
4.5 |
|
|
3.2 |
|
|
1.2 |
|
|
1.1 |
|
|
2.4 |
|
[Mechanics] Problem 9:
|
For this set of Sample Data: |
|
|
8 |
|
|
6 |
|
|
4 |
|
|
3 |
|
[Mechanics] Problem 10:
|
For this set of Sample Data: |
|
|
1.35 |
|
|
2.5 |
|
|
1.75 |
|
|
3.6 |
|
SOLUTIONS:
1.
|
For this set of Population Data: |
||||
|
x-xbar |
(x-xbar)2 |
|||
|
20 |
-30 |
900 |
||
|
40 |
-10 |
100 |
||
|
50 |
0 |
0 |
||
|
60 |
10 |
100 |
||
|
80 |
30 |
900 |
||
|
Sum= |
250 |
Sum= |
2000 |
|
|
n= |
5 |
Sum/Count= |
400 |
|
|
Mean = |
50 |
Check= |
20 |
|
|
Standard Deviation = |
20 |
|||
2.
|
For this set of Population Data: |
||||
|
x-xbar |
(x-xbar)2 |
|||
|
36 |
12 |
144 |
||
|
42 |
18 |
324 |
||
|
12 |
-12 |
144 |
||
|
10 |
-14 |
196 |
||
|
20 |
-4 |
16 |
||
|
Sum= |
120 |
Sum= |
824 |
|
|
n= |
5 |
Sum/Count= |
164.8 |
|
|
Mean = |
24 |
Check= |
12.83744523 |
|
|
Standard Deviation = |
12.83744523 |
|||
3.
|
For this set of Population Data: |
||||
|
x-xbar |
(x-xbar)2 |
|||
|
3.25 |
-1.6875 |
2.84765625 |
||
|
4.25 |
-0.6875 |
0.47265625 |
||
|
6.75 |
1.8125 |
3.28515625 |
||
|
5.5 |
0.5625 |
0.31640625 |
||
|
Sum= |
19.75 |
Sum= |
6.921875 |
|
|
n= |
4 |
Sum/Count= |
1.73046875 |
|
|
Mean = |
4.9375 |
Check= |
1.315472824 |
|
|
Standard Deviation = |
1.315472824 |
|||
4.
|
For this set of Population Data: |
||||
|
x-xbar |
(x-xbar)2 |
|||
|
-4 |
-4 |
16 |
||
|
0 |
0 |
0 |
||
|
2 |
2 |
4 |
||
|
-8 |
-8 |
64 |
||
|
10 |
10 |
100 |
||
|
Sum= |
0 |
Sum= |
184 |
|
|
n= |
5 |
Sum/Count= |
36.8 |
|
|
Mean = |
0 |
Check= |
6.066300355 |
|
|
Standard Deviation = |
6.066300355 |
|||
5.
|
For this set of Population Data: |
||||
|
x-xbar |
(x-xbar)2 |
|||
|
16 |
6.25 |
39.0625 |
||
|
20 |
10.25 |
105.0625 |
||
|
-3 |
-12.75 |
162.5625 |
||
|
6 |
-3.75 |
14.0625 |
||
|
Sum= |
39 |
Sum= |
320.75 |
|
|
n= |
4 |
Sum/Count= |
80.1875 |
|
|
Mean = |
9.75 |
Check= |
8.954747344 |
|
|
Standard Deviation = |
8.954747344 |
|||
6.
|
For this set of Sample Data: |
||||
|
x-xbar |
(x-xbar)2 |
|||
|
20 |
-30 |
900 |
||
|
40 |
-10 |
100 |
||
|
50 |
0 |
0 |
||
|
60 |
10 |
100 |
||
|
80 |
30 |
900 |
||
|
Sum= |
250 |
Sum= |
2000 |
|
|
n= |
5 |
Sum/Count= |
500 |
|
|
Less Correction factor "-1" |
||||
|
Mean = |
50 |
Check= |
22.36067977 |
|
|
Standard Deviation = |
22.36067977 |
|||
7.
|
For this set of Sample Data: |
||||
|
x-xbar |
(x-xbar)2 |
|||
|
0 |
-4.6 |
21.16 |
||
|
-4 |
-8.6 |
73.96 |
||
|
2 |
-2.6 |
6.76 |
||
|
8 |
3.4 |
11.56 |
||
|
17 |
12.4 |
153.76 |
||
|
Sum= |
23 |
Sum= |
267.2 |
|
|
n= |
5 |
Sum/Count= |
66.8 |
|
|
Less Correction factor "-1" |
||||
|
Mean = |
4.6 |
Check= |
8.173126697 |
|
|
Standard Deviation = |
8.173126697 |
|||
8.
|
For this set of Sample Data: |
||||
|
x-xbar |
(x-xbar)2 |
|||
|
4.5 |
2.02 |
4.0804 |
||
|
3.2 |
0.72 |
0.5184 |
||
|
1.2 |
-1.28 |
1.6384 |
||
|
1.1 |
-1.38 |
1.9044 |
||
|
2.4 |
-0.08 |
0.0064 |
||
|
Sum= |
12.4 |
Sum= |
8.148 |
|
|
n= |
5 |
Sum/Count= |
2.037 |
|
|
Less Correction factor "-1" |
||||
|
Mean = |
2.48 |
Check= |
1.427235089 |
|
|
Standard Deviation = |
1.427235089 |
|||
9.
|
For this set of Sample Data: |
||||
|
x-xbar |
(x-xbar)2 |
|||
|
8 |
2.75 |
7.5625 |
||
|
6 |
0.75 |
0.5625 |
||
|
4 |
-1.25 |
1.5625 |
||
|
3 |
-2.25 |
5.0625 |
||
|
Sum= |
21 |
Sum= |
14.75 |
|
|
n= |
4 |
Sum/Count= |
4.916666667 |
|
|
Less Correction factor "-1" |
||||
|
Mean = |
5.25 |
Check= |
2.217355783 |
|
|
Standard Deviation = |
2.217355783 |
|||
10.
|
For this set of Sample Data: |
||||
|
x-xbar |
(x-xbar)2 |
|||
|
1.35 |
-0.95 |
0.9025 |
||
|
2.5 |
0.2 |
0.04 |
||
|
1.75 |
-0.55 |
0.3025 |
||
|
3.6 |
1.3 |
1.69 |
||
|
Sum= |
9.2 |
Sum= |
2.935 |
|
|
n= |
4 |
Sum/Count= |
0.978333333 |
|
|
Less Correction factor "-1" |
||||
|
Mean = |
2.3 |
Check= |
0.989107342 |
|
|
Standard Deviation = |
0.989107342 |
|||