Mapping Population Distribution
Welcome Map Makers!
We have been studying population and now will be taking a Geospatial look at population using Google Maps. “Geospatial information influences nearly everything. Seamless layers of satellites, surveillance, and location-based technologies create a worldwide geographic knowledge base vital to solving myriad social and environmental problems in the interconnected global community.” (Penn State Geospatial Revolution- view video to learn more at http://geospatialrevolution.psu.edu/) That means that you are taking your information and putting it on a map that you can study and see how the population has influenced society and it can also be used to solve real problems.
Background:
Economist Jeffrey Sachs, the former head of the United Nations Millennium Project, believes that there are two reasons why global population and extreme poverty occur where they do: 1) capitalism distributes wealth to nations better than socialism or communism; 2) geography is a major factor in population distribution in relation to wealth. For example, population tends to be lower in extreme environments such as arid climates, rainforests, polar or mountainous regions. Another example is a nation that has a large body of water within its borders or has large minerals deposits/resources is likely to have more wealth and population.
Humans only occupy five percent of the Earth’s surface because oceans, deserts, rainforests, and glaciers cover much of the planet. The term for areas where humans permanently settle is called ecumene. Population growth and technology dramatically increase the ecumene of humans, which affects the world’s ecosystems.
It has been argued that the world can't support all the humans on the planet. On some level that's true and on another it is not. For example, we could actually pack all 7 billion humans in California, but that's not desirable, sanitary, or sustainable. The reality is that humans cannot live in many parts of the world due to moisture, temperature, or growing season issues. For example, 20 percent of the world is too dry to support humans. This mostly has to do with high-pressure systems around 30 degrees north and south of the equator where constant sunny conditions have created some of the world's largest deserts. Some of these include the Sahara, Arabian Peninsula, Thar, Takla Makan, and Gobi deserts. Most deserts do not provide enough moisture to support agriculture for large populations. Those who do live in these regions tend to raise animals and are considered nomads.
Regions that receive too much moisture also cause problems for human settlement. These are tropical rainforest regions located between the Tropic of Cancer (23.5 degrees North) and the Tropic of Capricorn (23.5 degrees South). The problem with these regions of the world has to do with the soil erosion due to high precipitation. High levels of precipitation greatly hinder agricultural production because nutrients in the soil are quickly washed away. This is partly why slash-and-burn agriculture occurs in these regions. Locals will burn part of the forest to put nutrients back into the ground. This only works for a short period of time because the precipitation washes away nutrients within a few years, so farmers move on to other parts of the forest with their slash-and-burn practices.
Additionally, regions that are too cold pose problems for large population clusters and food production. The cold polar regions have a short growing season and many of the polar regions have limited amounts of moisture because they are covered by high-pressure systems (much like the desert regions). Thus, cold polar regions are not only limited by temperature, they are also limited by lack of moisture despite access to snow, ice, and glaciers. Mountainous and highland regions lack population clusters for similar reasons: steep slopes, snow and ice cover, and short growing seasons.
Research:
Using the websites listed (or others of your choosing) find the information to fill the table below. You will use the information on the table on your Google Map so please complete all of the information. The Population Reference Bureau is a great resource and is linked to the table you are to complete for this assignment.
You know the populations of many countries across the globe. Now, let's look at populations in specific areas.
Use THIS WORKSHEET to explore the population of the cities.
Map:
We have looked at populations across the globe. Let's look at those things with a Geospatial perspective and create a map using the data we have researched and put together.
(You will need access to both tables from the Research section AND the worksheet from the Question section.)
Please view THIS video on how to create a Google Map.
What to label:
A Google Map
- Create a shape for each of the 30 countries you researched. Label them with the name of the country, the 2016 population, the projected 2030 population, and the GNI for each country.
- Create a marker for the 30 Megacities (the 10 from 1975, the 10 from 2000, and the 10 from 2025). Include the population and year in the detail box. (City Population Part 1)
- Create a marker for the 10 cities plus the 5 of your choosing. Include ALL of the information from the table in the details box. (City Population Part 2)
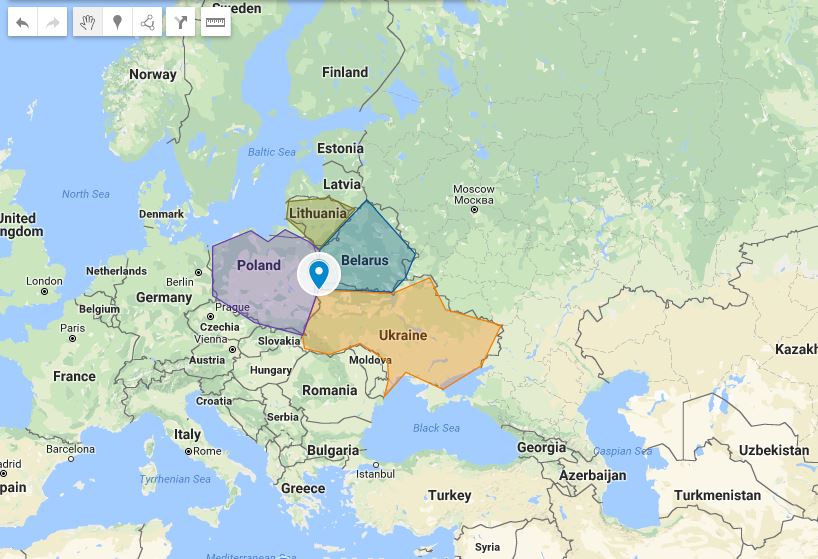
- All-in-all you should have 30 countries created with shapes, and 45 cities labeled and should look similar to the map above with countries outlined and colored as well as places marked with pins.