This unit uses scientific data to quantify the geologic hazard that earthquakes …
This unit uses scientific data to quantify the geologic hazard that earthquakes represent along transform plate boundaries. Students will document the characteristics of the Pacific/North American plate boundary in California, analyze information about historic earthquakes, calculate probabilities for earthquakes in the Los Angeles and San Francisco areas, and assess the regional earthquake probability map.
(Note: this resource was added to OER Commons as part of a batch upload of over 2,200 records. If you notice an issue with the quality of the metadata, please let us know by using the 'report' button and we will flag it for consideration.)
This unit initiates a discussion about the importance of recognizing faults in …
This unit initiates a discussion about the importance of recognizing faults in relation to modern societal infrastructure. Students consider the types of infrastructure necessary to support a modern lifestyle, especially for people living in population centers. Students also explore how key infrastructure such as aqueducts, power lines, or oil/gas pipelines, which traverse large distances, may also be susceptible to damage by earthquakes well away from the population centers. Additionally, earthquakes can occur in regions where none have occurred in recorded history. The ability to recognize and evaluate the potential for damage to key infrastructure that are near or cross a fault can be used, in turn, to classify and ultimately predict the most and least likely locations for damage, and to make suggestions for minimizing future impacts.
Show more about Online Teaching suggestions Hide Online-ready: The exercise is electronic and could be done individually or in small online groups (using the Google Earth rather than printable files). Lecture can be done in synchronous or asynchronous online format, although synchronous would allow better discussions of societal impacts of earthquakes.
(Note: this resource was added to OER Commons as part of a batch upload of over 2,200 records. If you notice an issue with the quality of the metadata, please let us know by using the 'report' button and we will flag it for consideration.)
How have mass-wasting events affected communities, and what lessons have we learned …
How have mass-wasting events affected communities, and what lessons have we learned from these natural disasters that might help us mitigate future hazards? In this unit, students answer these questions by being introduced to the landscape and societal characteristics that contributed to loss of property and life during the 1970 Nevado HuascarÃn (Peru) and 2010 San Fratello (Sicily, Italy) events.
Show more about Online Teaching suggestions Hide Online-ready: This opening class discussion about landslides and societal impacts could easily be converted to an online discussion format.
(Note: this resource was added to OER Commons as part of a batch upload of over 2,200 records. If you notice an issue with the quality of the metadata, please let us know by using the 'report' button and we will flag it for consideration.)
GPS data can measure bedrock motion in response to deformation of the …
GPS data can measure bedrock motion in response to deformation of the ground near plate boundaries because of plate tectonics. In this module, students will learn how to read GPS data to interpret how the bedrock deforms and moves, both absolutely and relatively, near the plate boundary in California and how that results in earthquakes. They will then apply the skills they developed and knowledge they gained to demonstrate their understanding of how GPS data has implications for future earthquakes in the region.
Show more about Online Teaching suggestions Hide Online-ready: All exercises are electronic and could be done individually or in small online groups. Lecture as currently provided is best done in synchronous format to retain interactive components. Authors provide a shortened version of Activities 1-3 combined into a single file used in their online courses. See below Condensed version for online.
(Note: this resource was added to OER Commons as part of a batch upload of over 2,200 records. If you notice an issue with the quality of the metadata, please let us know by using the 'report' button and we will flag it for consideration.)
Can active faults be identified remotely, based upon their appearance in the …
Can active faults be identified remotely, based upon their appearance in the landscape? How can the geomorphic features associated with active faults be used to classify and quantify fault movement? In this unit, students will analyze lidar data and remote sensing imagery, with the aim of discovering how different styles and timescales of faulting are recorded in the landscape. Concepts pertinent to earthquake hazard and infrastructure risk -- such as average slip per event, earthquake recurrence, and fault slip rate -- will be investigated.
Show more about Online Teaching suggestions Hide Online-ready: The exercise is electronic and could be done individually or in small online groups (using the Google Earth rather than printable files). Lecture can be done in synchronous or asynchronous online format.
(Note: this resource was added to OER Commons as part of a batch upload of over 2,200 records. If you notice an issue with the quality of the metadata, please let us know by using the 'report' button and we will flag it for consideration.)
This unit builds on what students have learned about transform fault hazards …
This unit builds on what students have learned about transform fault hazards to introduce the idea of risk. Students examine earthquake risk along the San Andreas Fault in San Francisco by examining public school sites around the city. Students calculate relative risk (risk = hazard probability x vulnerability x value) due to earthquake hazards at five sites, analyze different seismic hazard scenarios, communicate risks to stakeholders, and evaluate possible responses to seismic hazards. Students conclude with a summative assessment in which they reflect on the value of earthquake forecasts and warnings in mitigating risk.
(Note: this resource was added to OER Commons as part of a batch upload of over 2,200 records. If you notice an issue with the quality of the metadata, please let us know by using the 'report' button and we will flag it for consideration.)
Students work in small groups to examine data and videos of earthquakes, …
Students work in small groups to examine data and videos of earthquakes, submarine volcanic eruptions, and black smokers at submarine divergent plate boundaries, and then predict similar processes at subaerial divergent plate boundaries. The culminating activity has students use Google Earth to examine data for each plate boundary, connect seismic data with volcanic events to make connections between the style and scale of volcanic eruptions and seismic activity, and the resulting morphology of divergent plate boundaries. Data sets will include Google Earth, Smithsonian GVN, NOAA, USGS, and written accounts.
(Note: this resource was added to OER Commons as part of a batch upload of over 2,200 records. If you notice an issue with the quality of the metadata, please let us know by using the 'report' button and we will flag it for consideration.)
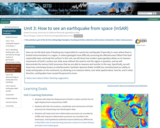
How can we tell what style of faulting was responsible for a …
How can we tell what style of faulting was responsible for a particular earthquake? Especially in cases where there is limited instrumentation in a region, or where geologists have difficulty accessing the affected areas? What if the fault responsible does not break the surface? In this unit, we will show how modern space geodesy allows us to measure movements of Earth's surface over wide areas without the need to visit the region in question, and we will demonstrate the various Earth processes that we are able to measure and monitor in this way. Specifically, we will show how a technique known as Interferometric Synthetic Aperture Radar (InSAR) has revolutionized our ability to study earthquakes on the continents, by allowing us to measure where, over what spatial extent, how far, and in what direction, earthquakes have caused the ground to move.
Show more about Online Teaching suggestions Hide Online-ready: The exercise is electronic and could be done individually or in small online groups. Lecture can be done in an online format. A synchronous session is recommended.
(Note: this resource was added to OER Commons as part of a batch upload of over 2,200 records. If you notice an issue with the quality of the metadata, please let us know by using the 'report' button and we will flag it for consideration.)
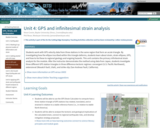
Students work with GPS velocity data from three stations in the same …
Students work with GPS velocity data from three stations in the same region that form an acute triangle. By investigating how the ellipse inscribed within this triangle deforms, students learn about strain, strain ellipses, GPS, and how to tie these to regional geology and ongoing hazards. This unit contains the primary infinitesimal strain analysis for the module. After the instructor demonstrates the method using data from Japan, students investigate three different GPS station triangles in three difference tectonic regimes: convergent (U.S. Pacific Northwest), extensional (Wasatch fault, Utah), and strike-slip (San Andreas Fault, California).
Show more information on GPS versus GNSS Hide Note: Although the term GPS (Global Positioning System) is more commonly used in everyday language, it officially refers only to the USA's constellation of satellites. GNSS (Global Navigation Satellite System) is a universal term that refers to all satellite navigation systems including those from the USA (GPS), Russia (GLONASS), European Union (Galileo), China (BeiDou), and others. In this module, we use the term GPS even though, technically, some of the data may be coming from satellites in other systems.
Show more about Online Teaching suggestions Hide Online-ready: The exercise is electronic (including accessing an online data portal) and could be done individually or in small online groups. Lecture can be done in synchronous or asynchronous online format.
(Note: this resource was added to OER Commons as part of a batch upload of over 2,200 records. If you notice an issue with the quality of the metadata, please let us know by using the 'report' button and we will flag it for consideration.)
Volcanoes typically give warning that they are coming out of dormancy and …
Volcanoes typically give warning that they are coming out of dormancy and entering an eruptive phase. Being able to recognize those warning signs and take appropriate actions (e.g. evacuations) are important strategies for mitigating risk due to volcanic eruptions. In this activity, students document and interpret ground deformation and seismic activity associated with the 2010 eruption of Iceland's Eyjafjallajokull volcano, from its pre-eruption dormancy, through precursor activity, through the eruption and back into dormancy. Students learn how to recognize data characteristic of an imminent eruption and discover the time frame of precursor activity.
(Note: this resource was added to OER Commons as part of a batch upload of over 2,200 records. If you notice an issue with the quality of the metadata, please let us know by using the 'report' button and we will flag it for consideration.)
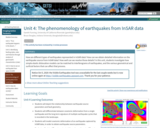
How are different types of earthquakes represented in InSAR data? How can …
How are different types of earthquakes represented in InSAR data? How can we obtain detailed information on the earthquake source from InSAR data? How well can we resolve those details? In this unit, students investigate how simple elastic dislocation models can be matched to interferograms of earthquakes, and the various geometrical and surficial factors that can affect that process.
Notice Oct 5, 2020: the Visible Earthquakes tool was unavailable for the last couple weeks but is now online again at https://visible-earthquakes.appspot.com. Thank you for your patience.
Show more about Online Teaching suggestions Hide Online-ready: The exercise is electronic and could be done individually or in small online groups. Lecture can be done in an online format. A synchronous session is recommended.
(Note: this resource was added to OER Commons as part of a batch upload of over 2,200 records. If you notice an issue with the quality of the metadata, please let us know by using the 'report' button and we will flag it for consideration.)
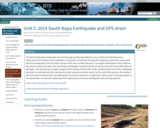
The 2014 South Napa earthquake was the first large earthquake (Mag 6) …
The 2014 South Napa earthquake was the first large earthquake (Mag 6) to occur within the Plate Boundary Observatory GPS network since installation. It provides an excellent example for studying crustal strain associated with the earthquake cycle of a strike-slip fault with clear societal relevance. The largest earthquake in the California Bay Area in twenty-five years, the South Napa earthquake caused hundreds of injuries and more than $400 million in damages. This activity uses a single triangle of GPS stations (P198, P200, SVIN), located to the west of the earthquake epicenter, to estimate both the interseismic strain rate and coseismic strain. By the end of the exercise, the students also have direct evidence that considering the recurrence interval on a single fault, which is part of a larger system, is not reasonable. An extension option gives the opportunity to discuss earthquake early warning systems.
Show more information on GPS versus GNSS Hide Note: Although the term GPS (Global Positioning System) is more commonly used in everyday language, it officially refers only to the USA's constellation of satellites. GNSS (Global Navigation Satellite System) is a universal term that refers to all satellite navigation systems including those from the USA (GPS), Russia (GLONASS), European Union (Galileo), China (BeiDou), and others. In this module, we use the term GPS even though, technically, some of the data may be coming from satellites in other systems.
Show more about Online Teaching suggestions Hide Online-ready: The exercise is electronic (including accessing an online data portal) and could be done individually or in small online groups. Lecture can be done in synchronous or asynchronous online format.
(Note: this resource was added to OER Commons as part of a batch upload of over 2,200 records. If you notice an issue with the quality of the metadata, please let us know by using the 'report' button and we will flag it for consideration.)
In this two-day activity, students monitor an evolving volcanic crisis at a …
In this two-day activity, students monitor an evolving volcanic crisis at a convergent plate boundary (Cascadia). Using monitoring data and geologic hazard maps, students make a series of forecasts for the impending eruption and associated risks. By the end of the activity, students will have learned the outcome of the eruption and assess the impacts of the eruption of Mount Rainier on specific locations around the volcano. This unit begins by having students examine past volcanic eruptions at Mount St. Helens, associated with the Cascadia convergent plate boundary, through firsthand accounts by United States Geological Survey (USGS) personnel who describe their work monitoring the geologic activity and some associated impacts. During class on the first day (Unit 5), students will begin working in small groups to interpret one of three data sets used to monitor volcanic activity (seismic, gas and ash emissions, and tilt). During prework and in-class activities for day 2 (Unit 6), students will update their predictions by combining information from all three data sets in mixed groups in which students act as "experts" for a particular data set. The exercise culminates with students assessing the impacts of a simulated volcanic eruption at their assigned locations.
(Note: this resource was added to OER Commons as part of a batch upload of over 2,200 records. If you notice an issue with the quality of the metadata, please let us know by using the 'report' button and we will flag it for consideration.)
Unit 5 is a final exercise that can start during a lab …
Unit 5 is a final exercise that can start during a lab period and carry over into work outside of the lab time. The project report will test students' abilities to synthesize and apply knowledge related to LiDAR, InSAR, and infrastructure analysis learned in earlier units of the module. Data are provided for two potential case study sites for the final report -- El Major Cucapah Earthquake (Mexico 2010) and South Napa Earthquake (California 2014). Alternatively, the instructor or students can choose other sites to analyze. Unit 5, along with an exam question, is the summative assessment for the module. Students will be able to use the experience as a means of preparing for a final exam question on a related topic.
Show more about Online Teaching suggestions Hide Online-ready: The exercise is a final project that can be done remotely, individually or in small online groups.
(Note: this resource was added to OER Commons as part of a batch upload of over 2,200 records. If you notice an issue with the quality of the metadata, please let us know by using the 'report' button and we will flag it for consideration.)
Students select their own set of three stations in an area of …
Students select their own set of three stations in an area of interest to them, conduct a strain analysis of the area between the stations, and tie the findings to regional tectonics and societal impacts in a 5 -- 7 minute class presentation. For many students this is their first foray into "research" and can be a powerfully eye-opening and exciting (if intimidating) experience. In larger classes, students can work in pairs to shorten total time needed for presentations. Unit 6, along with exam question/s, is the Summative Assessment for the module.
Show more about Online Teaching suggestions Hide Online-ready: The exercise is a final project that can be done remotely, individually or in small online groups. Final presentations could be done in a synchronous class period.
(Note: this resource was added to OER Commons as part of a batch upload of over 2,200 records. If you notice an issue with the quality of the metadata, please let us know by using the 'report' button and we will flag it for consideration.)
In this two-day activity, students monitor a simulated evolving volcanic crisis at …
In this two-day activity, students monitor a simulated evolving volcanic crisis at a convergent plate boundary (Cascadia). Using monitoring data and geologic hazard maps, students make a series of forecasts for the impending eruption and associated risks. By the end of the activity, students will have learned the outcome of the eruption and assess the impacts of the eruption of Mount Rainier on specific locations around the volcano. This unit is a continuation of Unit 5, in which students analyzed simulated pre-eruption seismic, tilt, and gas emission data. In this, the second day of the simulation, students update their eruption forecasts based on new data (in the prework) and then (in groups in class) by combining information from multiple data sets. In class, each group assesses the vulnerability of one or more assigned locations near Mount Rainier. The exercise culminates with students assessing the impacts of the simulated eruption at their assigned locations.
(Note: this resource was added to OER Commons as part of a batch upload of over 2,200 records. If you notice an issue with the quality of the metadata, please let us know by using the 'report' button and we will flag it for consideration.)
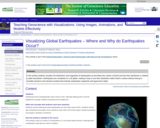
This screenshot from this visualization shows a map of tectonic plate boundaries. …
This screenshot from this visualization shows a map of tectonic plate boundaries. The visualization transitions between global earthquake distribution to a map of plate boundaries, to clearly illustrate how they are related. This visualization also includes an overview of the distribution and magnitude of earthquakes at different types of plate boundaries. Click the image to enlarge or view the MP4 movie ( PRIVATE FILE 31.1MB Jul27 11). The purpose of this activity is to introduce students to the distribution of earthquakes at and below the surface of earth and how their distribution is related to the geometry and type of plate boundaries. Because the depth of earthquakes can be difficult for students to visualize in 2D representations, this activity allows students to visualize the 3D distribution of earthquakes within Earth's surface, which is essential for understanding how different types of earthquakes occur in different tectonic settings. Talking points and questions are included to use this visualization as part of an interactive lecture. In addition to playing back the visualization, instructors can also download the visualization software and data set and explore it themselves.
(Note: this resource was added to OER Commons as part of a batch upload of over 2,200 records. If you notice an issue with the quality of the metadata, please let us know by using the 'report' button and we will flag it for consideration.)
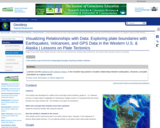
Learners use the UNAVCO GPS Velocity Viewer, or the included map packet …
Learners use the UNAVCO GPS Velocity Viewer, or the included map packet to visualize relationships between earthquakes, volcanoes, and plate boundaries as a jigsaw activity.
(Note: this resource was added to OER Commons as part of a batch upload of over 2,200 records. If you notice an issue with the quality of the metadata, please let us know by using the 'report' button and we will flag it for consideration.)
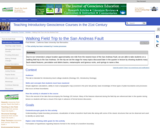
In preparation for this walking field trip to the San Andreas Fault, …
In preparation for this walking field trip to the San Andreas Fault, students ideally have attended two lecture sessions where plate boundary processes and features have been discussed formally. The expected outcomes include students that are capable of calculating rupture length based on elastic rebound theory, recurrence interval, and relative plate motion and rates. The field trip procedure and details for each stop are included in the lab manual below.
(Note: this resource was added to OER Commons as part of a batch upload of over 2,200 records. If you notice an issue with the quality of the metadata, please let us know by using the 'report' button and we will flag it for consideration.)
No restrictions on your remixing, redistributing, or making derivative works. Give credit to the author, as required.
Your remixing, redistributing, or making derivatives works comes with some restrictions, including how it is shared.
Your redistributing comes with some restrictions. Do not remix or make derivative works.
Most restrictive license type. Prohibits most uses, sharing, and any changes.
Copyrighted materials, available under Fair Use and the TEACH Act for US-based educators, or other custom arrangements. Go to the resource provider to see their individual restrictions.