In this activity, students discover the relationship between an object's mass and …
In this activity, students discover the relationship between an object's mass and the amount of space it takes up (its volume). Students learn about the concept of displacement and how an object can float if it displaces enough water, and the concept of density and its relationship to mass and volume.
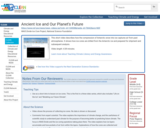
This short video describes how the compression of Antarctic snow into ice …
This short video describes how the compression of Antarctic snow into ice captures air from past atmospheres. It shows how ice cores are drilled from the Antarctic ice and prepared for shipment and subsequent analysis.
A student activity to determine the angle of repose and what factors …
A student activity to determine the angle of repose and what factors determine the angle of repose.
(Note: this resource was added to OER Commons as part of a batch upload of over 2,200 records. If you notice an issue with the quality of the metadata, please let us know by using the 'report' button and we will flag it for consideration.)
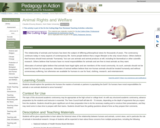
The relationship of animals and humans has been the subject of differing …
The relationship of animals and humans has been the subject of differing philosophical views for thousands of years. The controversy continues today in many aspects of contemporary life. Some people believe that a vegan lifestyle is the only moral choice. Others believe that humans should treat animals "humanely," but can use animals and animal products at will, including for biomedical or other scientific research. Others believe that humans have no moral responsibilities for animals and are free to treat animals as they want. Advocates of animal rights believe that animals have legal rights and are members of the moral community. As such, animals should not be used by humans for any purpose. Advocates of animal welfare believe that non-human animals should be treated humanely and without unnecessary suffering, but otherwise are available for humans to use for food, clothing, research, and entertainment.
(Note: this resource was added to OER Commons as part of a batch upload of over 2,200 records. If you notice an issue with the quality of the metadata, please let us know by using the 'report' button and we will flag it for consideration.)
Students are shown a series of animations in powerpoint. Each powerpoint slide …
Students are shown a series of animations in powerpoint. Each powerpoint slide illustrates a basic concept in reflection and refraction (e.g., Snell's law, Crossover distance, Crossover time, dipping layers, multiple interfaces. As the slides are animated, students see the distance versus time relationships. These slides can be given to students so that they can review the concepts as many times as is necessary. Addresses student misconceptions
(Note: this resource was added to OER Commons as part of a batch upload of over 2,200 records. If you notice an issue with the quality of the metadata, please let us know by using the 'report' button and we will flag it for consideration.)
This map shows how much electrical power is produced from wind in …
This map shows how much electrical power is produced from wind in each state from 1999 through 2010. The animation shows a general increase in the amount of wind power produced per state and the number of states producing it.
Students will create an animation to represent one of the many feedback …
Students will create an animation to represent one of the many feedback loops that influences climate change. To create their animation, students will use clay, cut paper, whiteboard or other materials commonly found in the classroom. They will make a storyboard, plan a narration, rehearse their animation and then film their animation with stop-motion photography.
(Note: this resource was added to OER Commons as part of a batch upload of over 2,200 records. If you notice an issue with the quality of the metadata, please let us know by using the 'report' button and we will flag it for consideration.)
Annotations are short and cannot give detailed information, but they should cover …
Annotations are short and cannot give detailed information, but they should cover these points: 1. The general contents of the work. What does it discuss and how detailed is it? This is the main portion of the annotation. 2. The author's qualifications. Is the writer a trained scholar? A journalist? Someone relating a personal experience? 3. An evaluation of the reliability. Is the information given reliable? Are facts or opinions stressed? 4. The intended audience. Is it for a general reader or a specialist? How much, if any, background knowledge is needed to understand it? Was is easy or difficult to read?
(Note: this resource was added to OER Commons as part of a batch upload of over 2,200 records. If you notice an issue with the quality of the metadata, please let us know by using the 'report' button and we will flag it for consideration.)
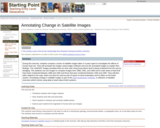
During this exercise, students compare a series of satellite images taken 3-4 …
During this exercise, students compare a series of satellite images taken 3-4 years apart to investigate the effects of human land use and annotate the images using ImageJ software.
(Note: this resource was added to OER Commons as part of a batch upload of over 2,200 records. If you notice an issue with the quality of the metadata, please let us know by using the 'report' button and we will flag it for consideration.)
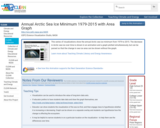
This series of visualizations show the annual Arctic sea ice minimum from …
This series of visualizations show the annual Arctic sea ice minimum from 1979 to 2015. The decrease in Arctic sea ice over time is shown in an animation and a graph plotted simultaneously, but can be parsed so that the change in sea ice area can be shown without the graph.
What would happen if a portion of the Antarctic Ice Sheet were …
What would happen if a portion of the Antarctic Ice Sheet were to melt? This video segment adapted from NOVA uses animations to show the effect of a 6-meter sea-level rise on coastal cities across the world.
What happens when the ground under your feet is ice and it's …
What happens when the ground under your feet is ice and it's moving? This video segment adapted from NOVA features some of the dangers faced by scientists conducting research in Antarctica.
This short video examines the recent melting ice shelves in the Antarctica …
This short video examines the recent melting ice shelves in the Antarctica Peninsula; the potential collapse of West Antarctic ice shelf; and how global sea levels, coastal cities, and beaches would be affected.
This article includes links to expository text for students in grades K-1, …
This article includes links to expository text for students in grades K-1, 2-3, and 4-5 about the climate differences between the Arctic and Antarctica.
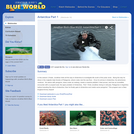
In this video, Jonathan treks all the way to Antarctica to investigate …
In this video, Jonathan treks all the way to Antarctica to investigate life south of the polar circle. Along the way he dives in the majestic kelp forests of Patagonia, where crabs rule the sea floor. Once he arrives in Antarctica, his adventures continue. He swims with penguins, dives under an iceberg, meets a massive jellyfish 3 feet wide, and has an incredible encounter with a Leopard seal, the apex predator of Antarctica. Part 1 finds Jonathan diving in Ushuaia, Patagonia in Argentina before boarding the ship to Antarctica, then he finally gets to Antarctica and meets some penguins! This program won a New England Emmy Award! Please see the accompanying lesson plan for educational objectives, discussion points and classroom activities.
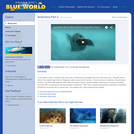
In this video, Jonathan treks all the way to Antarctica to investigate …
In this video, Jonathan treks all the way to Antarctica to investigate life south of the polar circle. Along the way he dives in the majestic kelp forests of Patagonia, where crabs rule the sea floor. Once he arrives in Antarctica, his adventures continue. He swims with penguins, dives under an iceberg, meets a massive jellyfish 3 feet across, and has an incredible encounter with a Leopard seal, the apex predator of Antarctica. Part 2 finds Jonathan continuing his exploration of Antarctica including an encounter with a Leopard seal. This program won a New England Emmy Award! Please see the accompanying lesson plan for educational objectives, discussion points and classroom activities.
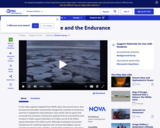
This video segment adapted from NOVA uses microwave images to reveal how …
This video segment adapted from NOVA uses microwave images to reveal how sea ice doubles the size of Antarctica each winter. Rare footage shows how sea ice crushed the famous ship Endurance in 1914.
This classroom activity introduces students to Antarctica's organisms, landscapes, and seascapes. After …
This classroom activity introduces students to Antarctica's organisms, landscapes, and seascapes. After examining the images in the photo gallery, students work in small groups to discuss their conclusions about the living conditions on this continent. The printable three-page handout includes a series of questions to help students structure their thoughts while viewing the gallery images and a group worksheet that guides students through a discussion of their evolving hypotheses and conclusions.
No restrictions on your remixing, redistributing, or making derivative works. Give credit to the author, as required.
Your remixing, redistributing, or making derivatives works comes with some restrictions, including how it is shared.
Your redistributing comes with some restrictions. Do not remix or make derivative works.
Most restrictive license type. Prohibits most uses, sharing, and any changes.
Copyrighted materials, available under Fair Use and the TEACH Act for US-based educators, or other custom arrangements. Go to the resource provider to see their individual restrictions.