This is designed as an introductory lab for hydrogeology or other upper-level …
This is designed as an introductory lab for hydrogeology or other upper-level courses that are quantitative in nature in order to review key mathematical concepts that will be used throughout the semester.
This course was originally developed for the Open Course Library project. The …
This course was originally developed for the Open Course Library project. The text used is Math in Society, edited by David Lippman, Pierce College Ft Steilacoom. Development of this book was supported, in part, by the Transition Math Project and the Open Course Library Project. Topics covered in the course include problem solving, voting theory, graph theory, growth models, finance, data collection and description, and probability.
Math in Society is a free, open textbook. This book is a …
Math in Society is a free, open textbook. This book is a survey of contemporary mathematical topics, most non-algebraic, appropriate for a college-level topics course for liberal arts majors. The text is designed so that most chapters are independent, allowing the instructor to choose a selection of topics to be covered. Emphasis is placed on the applicability of the mathematics. Core material for each topic is covered in the main text, with additional depth available through exploration exercises appropriate for in-class, group, or individual investigation. This book is appropriate for Math 107 (Washington State Community Colleges common course number).
This is a visual demonstration of the effects of aquifer parameters and …
This is a visual demonstration of the effects of aquifer parameters and stresses on the size and shape of zones of contribution. With these simple Matlab routines, students can rapidly observe zones of contributions for different sets of input parameters.
(Note: this resource was added to OER Commons as part of a batch upload of over 2,200 records. If you notice an issue with the quality of the metadata, please let us know by using the 'report' button and we will flag it for consideration.)
By measuring the spacing of fossil footprints it is possible to estimate …
By measuring the spacing of fossil footprints it is possible to estimate the speed of the trackmaker, but only after making several assumptions based on footprint size and the behavior of a wide range of living animals. A widely applied method for estimating speed from trackways was developed through the research of R. McNeill Alexander, an expert in biomechanics. This lab is a group exercise designed to lead students step-by-step through the methods and principles involved in estimating speed of movement from trackway data using Alexander's method. First students test the method on humans to see how accurate it is, and then they apply it to measurements taken from a variety of dinosaur trackways. This activity involves having students collect speed and footprint data on subjects while they are running and walking. The footprint data are analyzed and the speed estimates are compared to the actual measured speeds. Students then collect trackway measurements from published illustrations of dinosaur trackways to estimate dinosaur speeds. Students calculate the percent error for their experimental estimates and use this to interpret the results obtained from dinosaur trackways. Spreadsheets may be used to record and carry out the calculations in the analysis. Students are asked to discuss the significance of their results to ongoing debates over the physical capabilities of dinosaurs.
(Note: this resource was added to OER Commons as part of a batch upload of over 2,200 records. If you notice an issue with the quality of the metadata, please let us know by using the 'report' button and we will flag it for consideration.)
With printouts of typical GPS velocity vectors found near different tectonic boundaries …
With printouts of typical GPS velocity vectors found near different tectonic boundaries and models of a GPS station, demonstrate how GPS work to measure ground motion.GPS velocity vectors point in the direction that a GPS station moves as the ground it is anchored to moves. The length of a velocity vector corresponds to the rate of motion. GPS velocity vectors thus provide useful information for how Earth's crust deforms in different tectonic settings.
(Note: this resource was added to OER Commons as part of a batch upload of over 2,200 records. If you notice an issue with the quality of the metadata, please let us know by using the 'report' button and we will flag it for consideration.)
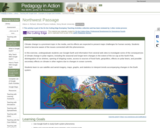
This lesson teaches middle and high school students to understand the architecture …
This lesson teaches middle and high school students to understand the architecture of GPS -- from satellites to research quality stations on the ground. This is done with physical models and a presentation. Then students learn to interpret data for the station's position through time ("time series plots"). Students represent time series data as velocity vectors and add the vectors to create a total horizontal velocity vector. They apply their skills to discover that the Mid-Atlantic Ridge is rifting Iceland. They cement and expand their understanding of GPS data with an abstraction using cars and maps. Finally, they explore GPS vectors in the context of global plate tectonics.
(Note: this resource was added to OER Commons as part of a batch upload of over 2,200 records. If you notice an issue with the quality of the metadata, please let us know by using the 'report' button and we will flag it for consideration.)
Because the campuses of the University of Kansas and the University of …
Because the campuses of the University of Kansas and the University of Houston are almost directly on a N-S line we can duplicate many aspects of the classic measurement of Eratosthenese in determining the circumference of the Earth. We use a web cast (backed up by cell phones) to communicate between the two campuses in real time. We measure the shadow of a 2 m stick in both locations at the same time and then go through the math required to calculate the size of the planet.
(Note: this resource was added to OER Commons as part of a batch upload of over 2,200 records. If you notice an issue with the quality of the metadata, please let us know by using the 'report' button and we will flag it for consideration.)
The calculation of the d-spacings, the angles between planes and zones, the …
The calculation of the d-spacings, the angles between planes and zones, the bond lengths and angles and other important geometric relationships for a mineral can be a tedious task for the student and the instructor, particularly when completed with the large assortment of trigonometric identities and algebraic formulae that are available. However, such calculations are straightforward and relatively easy to do when completed with the metrical matrix and the interactive software MATOP. Several applications of the matrix are presented here, each of which is worked out in detail and which is designed to teach its use in the study of crystal geometry.
(Note: this resource was added to OER Commons as part of a batch upload of over 2,200 records. If you notice an issue with the quality of the metadata, please let us know by using the 'report' button and we will flag it for consideration.)
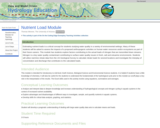
Students use the STELLA program to create hierarchies of models of increasing …
Students use the STELLA program to create hierarchies of models of increasing complexity to understand the absorption of solar energy by the Earth and its radiation of that energy back to space.
(Note: this resource was added to OER Commons as part of a batch upload of over 2,200 records. If you notice an issue with the quality of the metadata, please let us know by using the 'report' button and we will flag it for consideration.)
Students use a variety of tools to explore the interior of the …
Students use a variety of tools to explore the interior of the Earth in this inquiry activity.
(Note: this resource was added to OER Commons as part of a batch upload of over 2,200 records. If you notice an issue with the quality of the metadata, please let us know by using the 'report' button and we will flag it for consideration.)
Students pick a place of significance to them (their Special Place) for …
Students pick a place of significance to them (their Special Place) for analysis in this semester-long project. (A model is provided by the instructor using a place the students are not likely to have visited.)
(Note: this resource was added to OER Commons as part of a batch upload of over 2,200 records. If you notice an issue with the quality of the metadata, please let us know by using the 'report' button and we will flag it for consideration.)
An investigation of changes in polar regions using Google Earth. (Note: this …
An investigation of changes in polar regions using Google Earth.
(Note: this resource was added to OER Commons as part of a batch upload of over 2,200 records. If you notice an issue with the quality of the metadata, please let us know by using the 'report' button and we will flag it for consideration.)
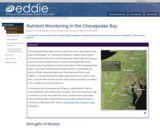
Estimating nutrient loads is a critical concept for students studying water quality …
Estimating nutrient loads is a critical concept for students studying water quality in a variety of environmental settings. Many of these students will be asked to assess the impacts of a proposed anthropogenic activities on human water resources and/or ecosystems as part of their future careers. This module has students explore factors contributing to the actual loads of nitrogen that are transmitted down streams. Nitrogen is a key water quality contaminant contributing to surface water quality issues in fresh, salt and estuarine environments. Students will utilize real-time nitrate data from the US Geological Survey to calculate nitrate loads for several locations and investigate the interplay of concentration and discharge that contributes to the calculated loads.
(Note: this resource was added to OER Commons as part of a batch upload of over 2,200 records. If you notice an issue with the quality of the metadata, please let us know by using the 'report' button and we will flag it for consideration.)
Provenance: Used with permission from the Chesapeake Bay Program: https://www.chesapeakebay.net/ Reuse: If …
Provenance: Used with permission from the Chesapeake Bay Program: https://www.chesapeakebay.net/ Reuse: If you wish to use this item outside this site in ways that exceed fair use (see http://fairuse.stanford.edu/) you must seek permission from its creator. The Chesapeake Bay waters receive input from rivers and streams from areas of Washington D.C, Maryland, Delaware, Virginia, West Virginia, and some parts of New York and Pennsylvania. Historically, humongous amounts of water pollution from nutrients discharged from these locations have reportedly occurred in the waters of the Chesapeake Bay region, such that it was entered into the list of the "Clean Water Act Section 303(d): Impaired Waters and Total Maximum Daily Loads (TMDLs)," compiled by the EPA. Water impairment occurs when a lake, river, or stream fails to meet specific water quality standards, according to its classification and intended use. According to the Chesapeake Bay Program, established in 1983 to reduce pollution and restore the ecosystem, "Plants and animals need nutrients to survive. But when too many nutrients enter waterways, they fuel the growth of algae blooms and create conditions that are harmful to underwater life." Source: Chesapeake Bay Program: Learn the Issues.
Data modeling activity using oil reserve and consumption data. Students predict when …
Data modeling activity using oil reserve and consumption data. Students predict when oil reserves meet or exceed reserves.
(Note: this resource was added to OER Commons as part of a batch upload of over 2,200 records. If you notice an issue with the quality of the metadata, please let us know by using the 'report' button and we will flag it for consideration.)
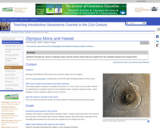
Students use the height and radius of Olympus Mons to estimate its …
Students use the height and radius of Olympus Mons to estimate its volume. They then propose a method to estimate the volume of lava that has erupted over from the Hawaiian hotspot over time. I then show them a graph of the cumulative volcanic volume as a function of distance from Kilauea (from Clague and Dalrymple). They compare these volumes and also consider the possibility that some of the lava erupted from the Hawaiian hotspot has been subducted.
(Note: this resource was added to OER Commons as part of a batch upload of over 2,200 records. If you notice an issue with the quality of the metadata, please let us know by using the 'report' button and we will flag it for consideration.)
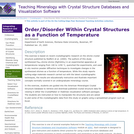
This exercise is based on recent crystallographic research on the olivine crystal …
This exercise is based on recent crystallographic research on the olivine crystal structure published by Redfern et al. (2000). The authors of this study synthesized Fa50 olivine olivine (MgFeSiO4) in an experimental apparatus at temperatures ranging from 100 to 1250 °C, quenched the experiments, and used in situ neutron powder diffraction techniques to investigate changes in the synthesized olivines as a function of temperature. While this study reports cutting-edge materials research carried out with the latest crystallographic techniques, the results are educationally instructive and illustrate important concepts normally covered in an undergraduate mineralogy course.
In this exercise, students are guided into the American Mineralogist Crystal Structure Database to retrieve and download published crystal structure data for viewing in either the CrystalMaker or XtalDraw visualization software packages. The students are instructed on how to manipulate the structures and are asked to plot some of the crystallographic data from this study on graphs using a spreadsheet program such as Excel.
(Note: this resource was added to OER Commons as part of a batch upload of over 2,200 records. If you notice an issue with the quality of the metadata, please let us know by using the 'report' button and we will flag it for consideration.)
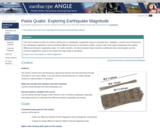
This short activity provides an intuitive introduction to earthquake magnitude using an …
This short activity provides an intuitive introduction to earthquake magnitude using an everyday item--spaghetti. Learners are introduced to the earthquake magnitude scale by breaking different amounts of uncooked noodles. Visual scale of the pasta emphasizes the relative differences between magnitudes with each whole step in magnitude. For older students, the demonstration helps students understand why seismologists use the nonlinear logarithmic scale to best graph the huge range of quantities.
(Note: this resource was added to OER Commons as part of a batch upload of over 2,200 records. If you notice an issue with the quality of the metadata, please let us know by using the 'report' button and we will flag it for consideration.)
No restrictions on your remixing, redistributing, or making derivative works. Give credit to the author, as required.
Your remixing, redistributing, or making derivatives works comes with some restrictions, including how it is shared.
Your redistributing comes with some restrictions. Do not remix or make derivative works.
Most restrictive license type. Prohibits most uses, sharing, and any changes.
Copyrighted materials, available under Fair Use and the TEACH Act for US-based educators, or other custom arrangements. Go to the resource provider to see their individual restrictions.