Project in which students calculate the magnitude of lunar and solar tidal …
Project in which students calculate the magnitude of lunar and solar tidal forces on the earth. They calculate the solar tidal effect relative to the lunar tidal effect and the relative solar tidal effect for spring-tide conditions.
(Note: this resource was added to OER Commons as part of a batch upload of over 2,200 records. If you notice an issue with the quality of the metadata, please let us know by using the 'report' button and we will flag it for consideration.)
This lab uses Google Earth to measure the rate of seacliff retreat. …
This lab uses Google Earth to measure the rate of seacliff retreat. It touches upon coastal processes, natural hazards, and coastal management issues. The central focus of the lab is in the Monterey Bay area.
(Note: this resource was added to OER Commons as part of a batch upload of over 2,200 records. If you notice an issue with the quality of the metadata, please let us know by using the 'report' button and we will flag it for consideration.)
This activity is designed to help students visualize and explain the relationships …
This activity is designed to help students visualize and explain the relationships between various terms and concepts related to the science of climate change. After performing this activity students will (hopefully) be able to define various climate change terms and explain the process of climate change.
(Note: this resource was added to OER Commons as part of a batch upload of over 2,200 records. If you notice an issue with the quality of the metadata, please let us know by using the 'report' button and we will flag it for consideration.)
This is a hands-on lab activity about evaporation. Learners will conduct experiments …
This is a hands-on lab activity about evaporation. Learners will conduct experiments to observe the process of evaporation. They will then describe the process of evaporation, and the general water cycle, through discussion and pictures. Background information, common preconceptions, a glossary and more is included. This activity is part of the Aquarius Hands-on Laboratory Activities.
Carbon science researchers and secondary school teachers invite young people to learn about local and global impacts of climate change, explore scientific research on the topic and act locally to reduce emissions of greenhouse gases.
In this video-based activity, students learn that sea level is an average …
In this video-based activity, students learn that sea level is an average measurement of the height of the ocean, and sea level changes with the seasons and over time. El Niño and La Ninña events are compared, demonstrating that sea height is a function of temperature.Summary background information, data and images supporting the activity are available on the Earth Update data site. To complete the activity, students will need to access the Space Update multimedia collection, which is available for download and purchase for use in the classroom.
In this lesson we review "Acids and Bases" taught in a previous …
In this lesson we review "Acids and Bases" taught in a previous lesson and, through a scientific method, will look at the impact of an acid on different types of shells. Students will reinforce previous learning of scientific principles including acids/basis and will develop a real experiment using the scientific method.
(Note: this resource was added to OER Commons as part of a batch upload of over 2,200 records. If you notice an issue with the quality of the metadata, please let us know by using the 'report' button and we will flag it for consideration.)
This activity is designed to introduce students to the way in which …
This activity is designed to introduce students to the way in which thermohaline circulation and the biological pump influence the distribution of nutrients, oxygen, carbon, and radiocarbon in the Atlantic vs. Pacific Oceans.
(Note: this resource was added to OER Commons as part of a batch upload of over 2,200 records. If you notice an issue with the quality of the metadata, please let us know by using the 'report' button and we will flag it for consideration.)
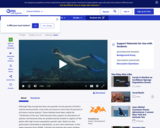
In this video, Jonathan explores how animals in the ocean use color, …
In this video, Jonathan explores how animals in the ocean use color, not just for camouflage, but to stand out. Please see the accompanying lesson plan for educational objectives, discussion points and classroom activities.
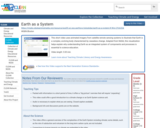
This short video uses animated imagery from satellite remote sensing systems to …
This short video uses animated imagery from satellite remote sensing systems to illustrate that Earth is a complex, evolving body characterized by ceaseless change. Adapted from NASA, this visualization helps explain why understanding Earth as an integrated system of components and processes is essential to science education.
Join Scripps' Bill Gerwick in an exploration of the potential uses of …
Join Scripps' Bill Gerwick in an exploration of the potential uses of one of the most ancient of all life forms - blue-green algae - as a source for new pharmaceuticals with used ranging from anticancer compounds to drug screening. (54 minutes)
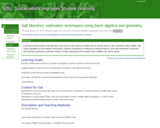
The activity allows for learning about salt marshes ecosystem and practicing of …
The activity allows for learning about salt marshes ecosystem and practicing of basic math in estimations.
(Note: this resource was added to OER Commons as part of a batch upload of over 2,200 records. If you notice an issue with the quality of the metadata, please let us know by using the 'report' button and we will flag it for consideration.)
Join Dr. Lynne Talley as she describes how she and others are …
Join Dr. Lynne Talley as she describes how she and others are using decades of ocean observations from floats, research vessels, and merchant ships to discern the long-term signal of climate change that is recorded in our oceans. (49 minutes)
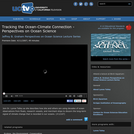
These two hands-on labs are about the role of temperature and salinity …
These two hands-on labs are about the role of temperature and salinity in governing the density of seawater, a major factor controlling the ocean's vertical movements and layered circulation. In the first activity students work in groups to determine the density of tap water and of tap water with salt, then compare the densities. The second activity investigates the role of temperature and salinity in determining seawater density. Students use a Temperature-Salinity (T-S) Diagram to examine the effect of mixing on density. A list of key concepts, essential questions, common preconceptions and more is included. These are part of the Aquarius Hands-on Laboratory Activities.
In this video segment, ZOOM guest Cassie takes us on a tour …
In this video segment, ZOOM guest Cassie takes us on a tour of the coral reef near her home in Key Largo, Florida, and points out some of its unique features.
This is a hands-on lab activity about the composition of salt. Learners …
This is a hands-on lab activity about the composition of salt. Learners will explain the general relationship between an element's Periodic Table Group Number and its tendency to gain or lose electron(s), and explain the difference between molecular compounds and ionic compounds. They will then use household materials to build a model to demonstrate sodium chloride's cubic form and describe the nature of the electrostatic attraction that holds the structure of salt together. Background information, common preconceptions, a glossary and more is included. This activity is part of the Aquarius Hands-on Laboratory Activities.
This video segment uses data-based visual NOAA representations to trace the path …
This video segment uses data-based visual NOAA representations to trace the path of surface ocean currents around the globe and explore their role in creating climate zones. Ocean surface currents have a major impact on regional climate around the world, bringing coastal fog to San Francisco and comfortable temperatures to the British Isles.
The deep ocean remains largely unexplored, and deep-sea animals, their distribution and …
The deep ocean remains largely unexplored, and deep-sea animals, their distribution and their relationships to each other are the subject of an ever-increasing variety of research projects. Join Scripps biological oceanographer Greg Rouse as he unveils the latest findings on some of the oceanŐs most intriguing and least-studied creatures and learn about the sophisticated tools used to understand the Evolution of life in the ocean. (57 minutes)
From mangroves to deep-sea reefs, join Brad Erisman and Octavio Aburto-Oropeza on …
From mangroves to deep-sea reefs, join Brad Erisman and Octavio Aburto-Oropeza on a grand tour presenting the diversity of marine life in the Gulf of California. Learn how humans impact these fragile ecosystems and how marine reserves and habitat monitoring provide scientists with critical information needed to protect and restore these amazing ecosystems. (51 minutes)
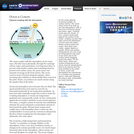
This page is part of NASA's Earth Observatory website. It features text …
This page is part of NASA's Earth Observatory website. It features text and a scientific illustration to describe how the ocean interacts with the atmosphere, physically exchanging heat, water, and momentum. It also includes links to related data sets, other ocean fact sheets, and relevant satellite missions.
No restrictions on your remixing, redistributing, or making derivative works. Give credit to the author, as required.
Your remixing, redistributing, or making derivatives works comes with some restrictions, including how it is shared.
Your redistributing comes with some restrictions. Do not remix or make derivative works.
Most restrictive license type. Prohibits most uses, sharing, and any changes.
Copyrighted materials, available under Fair Use and the TEACH Act for US-based educators, or other custom arrangements. Go to the resource provider to see their individual restrictions.