This is a second-semester graduate course on the geometry of manifolds. The …
This is a second-semester graduate course on the geometry of manifolds. The main emphasis is on the geometry of symplectic manifolds, but the material also includes long digressions into complex geometry and the geometry of 4-manifolds, with special emphasis on topological considerations.
Geometry of Manifolds analyzes topics such as the differentiable manifolds and vector …
Geometry of Manifolds analyzes topics such as the differentiable manifolds and vector fields and forms. It also makes an introduction to Lie groups, the de Rham theorem, and Riemannian manifolds.
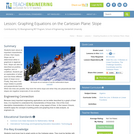
Students will calculate the glide slope ratio and angle of paper airplanes …
Students will calculate the glide slope ratio and angle of paper airplanes they have created. They will make claims about the type of airplane and support claims with evidence and reasoning from their class data.
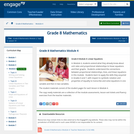
In Module 4, students extend what they already know about unit rates …
In Module 4, students extend what they already know about unit rates and proportional relationships to linear equations and their graphs. Students understand the connections between proportional relationships, lines, and linear equations in this module. Students learn to apply the skills they acquired in Grades 6 and 7, with respect to symbolic notation and properties of equality to transcribe and solve equations in one variable and then in two variables.
Find the rest of the EngageNY Mathematics resources at https://archive.org/details/engageny-mathematics.
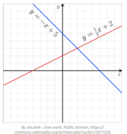
Students learn about an important characteristic of lines: their slopes. Slope can …
Students learn about an important characteristic of lines: their slopes. Slope can be determined either in graphical or algebraic form. Slope can also be described as positive, negative, zero or undefined. Students get an explanation of when and how these different types of slope occur. Finally, they learn how slope relates to parallel and perpendicular lines. When two lines are parallel, they have the same slope and when they are perpendicular their slopes are negative reciprocals of one another.
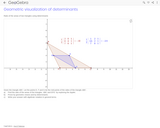
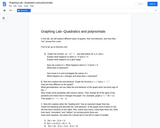
This lab is an investigative lab to help students make a visual …
This lab is an investigative lab to help students make a visual connection between quadratic and polynomial functions and their graphs. The lab uses desmos.com and takes about 30-45 minutes.
In this seminar, you will learn how to graph linear equations that …
In this seminar, you will learn how to graph linear equations that have been written in any form. You will learn the characteristics of intercepts, and also of horizontal and vertical lines. You will discover the various types of information that can be discovered by looking at the graph of a linear equation.StandardsCC.2.2.HS.D.10 Represent, solve, and interpret equations/inequalities and systems of equations/inequalities algebraically and graphically
Rebecca Davis sets up a coordinate plane on the floor of her …
Rebecca Davis sets up a coordinate plane on the floor of her classroom. Groups of 3 or 4 students are assigned equations in slope-intercept form and graph them using their bodies on the giant coordinate plane. As extensions, Ms. Davis changes the slope or y-intercept of the original equation and makes the activity into a race.
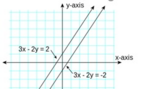
This seminar will allow you to solve a system of linear equations …
This seminar will allow you to solve a system of linear equations by graphing. It will help you to understand what it means when the lines in a system of equations are parallel, and also what it means for the graphs to be the same line. You will learn how to visually identify information about the system of equations simply by examining the graphs of the lines that make up the system.StandardsCC.2.2.HS.D.10Represent, solve, and interpret equations/inequalities and systems of equations/inequalities algebraically and graphically.
This seminar will teach you how to identify the graph of an …
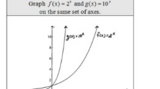
This seminar will teach you how to identify the graph of an exponential function. You will learn how to identify the properties of the function that explain the shape of the graph. The seminar will also show you how to graph an exponential function that you are given. You will learn about the properties of the graphs of exponential functions and how they are related to the properties of exponents. You will be guided through examples of graphing using tables and also using properties of the functions themselves.StandardsCC.2.2.HS.D.7Create and graph equations or inequalities to describe numbers or relationships.
This seminar will help you to understand how the graph of a …
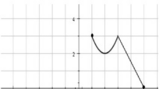
This seminar will help you to understand how the graph of a function relates to the function itself, and how to determine the domain and range of a function by examining its graph. It is necessary to be able to determine a function’s domain and range in order to understand how different functions are restricted by their rules. Understanding how to visually interpret functions by looking at their graphs will also allow you to quickly gather important information about the function. StandardsCC.2.2.HS.C.2 Graph and analyze functions and use their properties to make connections between the different representations.
This exploration can be done in class near the beginning of a …
This exploration can be done in class near the beginning of a unit on graphing parabolas. Students need to be familiar with intercepts, and need to know what the vertex is.
In this seminar you will learn how to graph quadratic functions and …
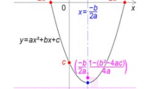
In this seminar you will learn how to graph quadratic functions and how to use these graphs to identify the roots, or solutions, of the function. You will learn how to use different arrangements of the equation in order to locate specific, important points for the graph. You will also learn why the intercepts of the function translate to solutions of the equation. StandardsCC.2.2.HS.C.5Construct and compare linear, quadratic, and exponential models to solve problems,
This task is designed to make students think about the meaning of …
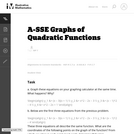
This task is designed to make students think about the meaning of the quantities presented in the context and choose which ones are appropriate for the two different constraints presented. In particular, note that the purpose of the task is to have students generate the constraint equations for each part (though the problem statements avoid using this particular terminology), and not to have students solve said equations.
This problem asks the students to represent a sequence of operations using …
This problem asks the students to represent a sequence of operations using an expression and then to write and solve simple equations. The problem is posed as a game and allows the students to visualize mathematical operations. It would make sense to actually play a similar game in pairs first and then ask the students to record the operations to figure out each other's numbers.
The lesson uses a Desmos Activity entitled Guess My Rule. Students will …
The lesson uses a Desmos Activity entitled Guess My Rule. Students will give an input to a "machine" and the machine will give an output. Students will then be asked to determine a rule that the machine uses to produce an output from the given input. The goal of this activity is to develop the definition of a function using examples and nonexamples.
No restrictions on your remixing, redistributing, or making derivative works. Give credit to the author, as required.
Your remixing, redistributing, or making derivatives works comes with some restrictions, including how it is shared.
Your redistributing comes with some restrictions. Do not remix or make derivative works.
Most restrictive license type. Prohibits most uses, sharing, and any changes.
Copyrighted materials, available under Fair Use and the TEACH Act for US-based educators, or other custom arrangements. Go to the resource provider to see their individual restrictions.