This problem allows the student to think geometrically about lines and then …
This problem allows the student to think geometrically about lines and then relate this geometry to linear functions. Or the student can work algebraically with equations in order to find the explicit equation of the line through two points (when that line is not vertical).
This task is designed as a follow-up to the task F-LE Do …
This task is designed as a follow-up to the task F-LE Do Two Points Always Determine a Linear Function? Linear equations and linear functions are closely related, and there advantages and disadvantages to viewing a given problem through each of these points of view. This task is intended to show the depth of the standard F-LE.2 and its relationship to other important concepts of the middle school and high school curriculum, including ratio, algebra, and geometry.
This task requires students to use the normal distribution as a model …
This task requires students to use the normal distribution as a model for a data distribution. Students must use given means and standard deviations to approximate population percentages. There are several ways (tables, graphing calculators, or statistical software) that students might calculate the required normal percentages. Depending on the method used, answers might vary somewhat from those shown in the solution.
The purpose of the task is to analyze a plausible real-life scenario …
The purpose of the task is to analyze a plausible real-life scenario using a geometric model. The task requires knowledge of volume formulas for cylinders and cones, some geometric reasoning involving similar triangles, and pays attention to reasonable approximations and maintaining reasonable levels of accuracy throughout.
The purpose of this task to help students think about an expression …
The purpose of this task to help students think about an expression for a function as built up out of simple operations on the variable, and understand the domain in terms of values for which each operation is invalid (e.g., dividing by zero or taking the square root of a negative number).
This task would be especially well-suited for instructional purposes. Students will benefit …
This task would be especially well-suited for instructional purposes. Students will benefit from a class discussion about the slope, y-intercept, x-intercept, and implications of the restricted domain for interpreting more precisely what the equation is modeling.
This task builds on a fifth grade fraction multiplication task and uses …
This task builds on a fifth grade fraction multiplication task and uses the identical context, but asks the corresponding ŇNumber of Groups UnknownÓ division problem.
This task builds on a fifth grade fraction multiplication task and uses …
This task builds on a fifth grade fraction multiplication task and uses the identical context, but asks the corresponding ŇNumber of Groups UnknownÓ division problem.
The purpose of this task is for students to study the impact …
The purpose of this task is for students to study the impact of dilations on different measurements: segment lengths, area, and angle measure. When a triangle is dilated by scale factor s>0, the base and height change by the scale factor s while the area changes by a factor of s2: as seen in the examples presented here, this is true regardless of the center of dilation.
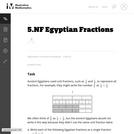
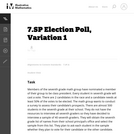
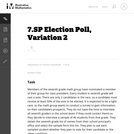
One goal of this task is to help students develop comfort and …
One goal of this task is to help students develop comfort and ease with adding fractions with unlike denominators. Another goal is to help them develop fraction number sense by having students decompose fractions. Because the Egyptians represented fractions differently than we do, it can also help students understand that there can be many ways of representing the same number.
The purpose of this task is to strengthen students' understanding of area. …
The purpose of this task is to strengthen students' understanding of area. It could be assigned in class to individuals or small groups or given as a homework exercise to generate interesting discussions the following day. The relatively high levels of complexity and technical demand enhance its instructional value.
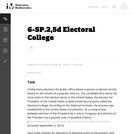
This task introduces the fundamental statistical ideas of using data summaries (statistics) …
This task introduces the fundamental statistical ideas of using data summaries (statistics) from random samples to draw inferences (reasoned conclusions) about population characteristics (parameters). In the task built around an election poll scenario, the population is the entire seventh grade class, the unknown characteristic (parameter) of interest is the proportion of the class members voting for a specific candidate, and the sample summary (statistic) is the observed proportion of voters favoring the candidate in a random sample of class members.
n addition to providing a task that relates to other disciplines (history, …
n addition to providing a task that relates to other disciplines (history, civics, current events, etc.), this task is intended to demonstrate that a graph can summarize a distribution as well as provide useful information about specific observations.
An important property of linear functions is that they grow by equal …
An important property of linear functions is that they grow by equal differences over equal intervals. In this task students prove this for equal intervals of length one unit, and note that in this case the equal differences have the same value as the slope. In F.LE Equal Differences over Equal Intervals 2, students prove the property in general (for equal intervals of any length).
No restrictions on your remixing, redistributing, or making derivative works. Give credit to the author, as required.
Your remixing, redistributing, or making derivatives works comes with some restrictions, including how it is shared.
Your redistributing comes with some restrictions. Do not remix or make derivative works.
Most restrictive license type. Prohibits most uses, sharing, and any changes.
Copyrighted materials, available under Fair Use and the TEACH Act for US-based educators, or other custom arrangements. Go to the resource provider to see their individual restrictions.