To get a better understanding of complex networks, students create their own, …
To get a better understanding of complex networks, students create their own, real social network example by interacting with their peers in the classroom and documenting the interactions. They represent the interaction data as a graph, calculate two mathematical quantities associated with the graph—the degree of each node and the degree distribution of the graph—and analyze how these quantities can be used to infer properties of the social network at hand.
Students are introduced to the health risks caused by cooking and heating …
Students are introduced to the health risks caused by cooking and heating with inefficient cook stoves inside homes, a common practice in rural developing communities. Students simulate the cook stove scenario and use the engineering design process, including iterative trials, to increase warmth inside a building while reducing air quality problems. Students then collect and graph data, and analyze their findings.
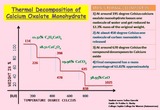
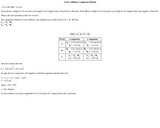
The pdf file attached contain thermogram depicting the decomposition of calcium oxalate …
The pdf file attached contain thermogram depicting the decomposition of calcium oxalate monohydrate. Stepwise decomposition including the temperatures, the percentage of compund decomposed and the names of the compound formed post decomposition are all depicted in the graph.
Students analyze dramatic works using graph theory. They gather data, record it …
Students analyze dramatic works using graph theory. They gather data, record it in Microsoft Excel and use Cytoscape (a free, downloadable application) to generate graphs that visually illustrate the key characters (nodes) and connections between them (edges). The nodes in the Cytoscape graphs are color-coded and sized according to the importance of the node (in this activity nodes represent characters in the work and their relative importance to the story). After the analysis, the graphs are further examined to see what the visual depiction of the story in the form of a graph tells readers about the inner workings of the dramatic work. Students gain practice with graph theory vocabulary, including node, edge, betweeness centrality and degree on interaction, and learn about a range of engineering applications of graph theory.
Students learn how to quickly and efficiently interpret graphs, which are used …
Students learn how to quickly and efficiently interpret graphs, which are used for everyday purposes as well as engineering analysis. Through a practice handout completed as a class and a worksheet completed in small groups, students gain familiarity in talking about and interpreting graphs. They use common graph terminology such as independent variable, dependent variable, linear data, linear relationship and rate of change. The equation for calculating slope is explained. The focus is on students becoming able to clearly describe linear relationships by using the language of slope and the rate of change between variables. At lesson end, students discuss the relationship between variables as presented by the visual representation of a graph. Then they independently complete a homework handout.
This web page is an interactive physics problem on vector addition. The …
This web page is an interactive physics problem on vector addition. The page explains the concept of breaking a vector into components and adding them together, and works through an example problem. The attached Java applet visualizes the problem. This is part of a collection of similar simulation-based student activities.
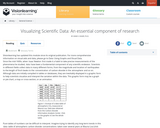
This module describes the purpose of using graphs and other data visualization …
This module describes the purpose of using graphs and other data visualization techniques and describes a simple three-step process that can be used to understand and extract information from graphs.
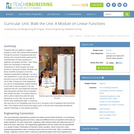
Prepared with pre-algebra or algebra 1 classes in mind, this module leads …
Prepared with pre-algebra or algebra 1 classes in mind, this module leads students through the process of graphing data and finding a line of best fit while exploring the characteristics of linear equations in algebraic and graphic formats. Then, these topics are connected to real-world experiences in which people use linear functions. During the module, students use these scientific concepts to solve the following hypothetical challenge: You are a new researcher in a lab, and your boss has just given you your first task to analyze a set of data. It being your first assignment, you ask an undergraduate student working in your lab to help you figure it out. She responds that you must determine what the data represents and then find an equation that models the data. You believe that you will be able to determine what the data represents on your own, but you ask for further help modeling the data. In response, she says she is not completely sure how to do it, but gives a list of equations that may fit the data. This module is built around the legacy cycle, a format that incorporates educational research feindings on how people best learn.
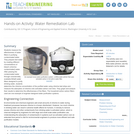
Students measure the effectiveness of water filters in purifying contaminated water. They …
Students measure the effectiveness of water filters in purifying contaminated water. They prepare test water by creating different concentrations of bleach (chlorine-contaminated) water. After passing the contaminated water through commercially available Brita® water filters designed to purify drinking water, students determine the chlorine concentration of the purified water using chlorine test strips and measure the adsorption of chlorine onto activated carbon over time. They graph and analyze their results to determine the effectiveness of the filters. The household active carbon filters used are one example of engineer-designed water purification systems.
This problem-based learning module is students will be collecting their personal health …
This problem-based learning module is students will be collecting their personal health numbers in a station rotation format. After choosing their health numbers to compare, the students will create a scatter plot and line of best fit using class data. Students will do a gallery walk to compare their health numbers with their peers. The students will then create a presentation for a health fair to bring awareness to health numbers based on their personal findings and facts.
No restrictions on your remixing, redistributing, or making derivative works. Give credit to the author, as required.
Your remixing, redistributing, or making derivatives works comes with some restrictions, including how it is shared.
Your redistributing comes with some restrictions. Do not remix or make derivative works.
Most restrictive license type. Prohibits most uses, sharing, and any changes.
Copyrighted materials, available under Fair Use and the TEACH Act for US-based educators, or other custom arrangements. Go to the resource provider to see their individual restrictions.