Textbook covering natural disasters and human impacts -- geosciences.
- Subject:
- Geology
- Physical Geography
- Physical Science
- Material Type:
- Full Course
- Date Added:
- 12/11/2019

Textbook covering natural disasters and human impacts -- geosciences.
Students characterize how climate change impacts natural hazards and pose research-based solutions to the county Emergency Management Agency. Presentations require the use of local data, created figures, and reliable sources. This activity builds from an assignment which has students identify and describe projected local climate trends using the USGS National Climate Change Viewer followed by Unit 1 and 2 of the Map Your Hazards InTeGrate Module.
(Note: this resource was added to OER Commons as part of a batch upload of over 2,200 records. If you notice an issue with the quality of the metadata, please let us know by using the 'report' button and we will flag it for consideration.)
Students apply the concepts learned in the class by preparing two (2) term projects discussing two natural hazards and how they impact the area where the student lives (or an area the student might like to live in).
(Note: this resource was added to OER Commons as part of a batch upload of over 2,200 records. If you notice an issue with the quality of the metadata, please let us know by using the 'report' button and we will flag it for consideration.)

Students are introduced to natural disasters, and learn the difference between natural hazards and natural disasters. They discover the many types of natural hazards avalanche, earthquake, flood, forest fire, hurricane, landslide, thunderstorm, tornado, tsunami and volcano as well as specific examples of natural disasters. Students also explore why understanding these natural events is important to engineers and everyone's survival on our planet.
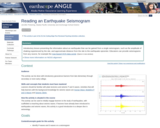
Introductory lesson that deconstructs the information that can be gleaned from a single seismogram.
(Note: this resource was added to OER Commons as part of a batch upload of over 2,200 records. If you notice an issue with the quality of the metadata, please let us know by using the 'report' button and we will flag it for consideration.)

In this activity, students replicate the slope failure experiment
presented by Densmore et al. (1997) in the journal Science. They are given the original article and the slope failure apparatus (along with all associated materials) and then they need to figure out how to replicate the experiment. Once they have completed an experimental run of sufficient length, they compile and analyze their data and compare it to the article's results.
After completing this portion of the lab, the students read the discussion and reply (Aalto et al., 1998; Densmore et al., 1998) and critically evaluate they results of the experiment and its applicability to the real world and landscape evolution.
(Note: this resource was added to OER Commons as part of a batch upload of over 2,200 records. If you notice an issue with the quality of the metadata, please let us know by using the 'report' button and we will flag it for consideration.)
Detailed information is provided in activity description/assignment and an example lab handout that assisted students in conducting their research.
Initial guidelines given to students:
Choose a location (where you are from, a place that is of interest to you) and investigate how projected changes in climate will affect that area. What are the expected changes in temperature, precipitation, storms, droughts, sea level, seasonality, etc? How will this affect the habitat of the area (for humans, animals, and plants)? How will this affect the local economy? What actions can the people that live in this area take to lessen the impacts of changing climate? Students write a scientific style paper on their findings, and present their research to the class in ~10 minute oral presentations (alternatively a poster session could be used).
(Note: this resource was added to OER Commons as part of a batch upload of over 2,200 records. If you notice an issue with the quality of the metadata, please let us know by using the 'report' button and we will flag it for consideration.)

This is the final lab for an Introductory Physical Geology class. Students apply a semester of learned geology skills toward evaluating house building sites near our campus. They encounter evidence of faulting, mass wasting, isostatic rebound, and ancient Alaskans as part of the exercise.
(Note: this resource was added to OER Commons as part of a batch upload of over 2,200 records. If you notice an issue with the quality of the metadata, please let us know by using the 'report' button and we will flag it for consideration.)

In this exercise, students use U.S. Geological Survey and other websites to learn about the history of earthquakes in New York. Through their web research, they will learn what earthquakes are, how and where they occur, and the types of hazards associated with large quakes. They are encouraged to write a report summarizing their results.

Students learn about various natural hazards and specific methods engineers use to prevent these hazards from becoming natural disasters. They study a hypothetical map of an area covered with natural hazards and decide where to place natural disaster prevention devices by applying their critical thinking skills and an understanding of the causes of natural disasters.
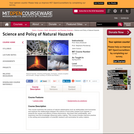
This course examines the science of natural catastrophes such as earthquakes and hurricanes and explores the relationships between the science of and policy toward such hazards. It presents the causes and effects of these phenomena, discusses their predictability, and examines how this knowledge influences policy making. This course includes intensive practice in the writing and presentation of scientific research and summaries for policy makers.
The Science of Disasters etextbook is a Softchalk activity designed to give students an introduction to disaster terminology including risk and resiliency. It is typically used as a pre-reading assignment for non-science majors in an introductory disasters class.
(Note: this resource was added to OER Commons as part of a batch upload of over 2,200 records. If you notice an issue with the quality of the metadata, please let us know by using the 'report' button and we will flag it for consideration.)
Using two sets of flubber, one representing the Earth and one representing a glacier, demonstrate how the crust sinks and rebounds to the weight of a glacier, and how this motion can be measured using GPS.Flubber is a rubbery elastic substance, a non-Newtonian elasco-plastic fluid, that flows under gravity, but breaks when under high stress. Flubber is useful for demonstrating a wide range of Earth and glacier processes.
(Note: this resource was added to OER Commons as part of a batch upload of over 2,200 records. If you notice an issue with the quality of the metadata, please let us know by using the 'report' button and we will flag it for consideration.)

Required for all Earth, Atmospheric, and Planetary Sciences majors in the Environmental Science track, this course is an introduction to current research in the field. Stresses integration of central scientific concepts in environmental policy making and the chemistry, biology, and geology environmental science tracks. Revisits selected core themes for students who have already acquired a basic understanding of environmental science concepts. The topic for this term is geoengineering.
This activity introduces students to basic functions and features of ArcGIS software and explores principles of a GIS and data set manipulations, using observational GPS data and satellite telemetry data collected from marine mammals fitted with transmitters. This activity provides an overview of using maps as scientific tools and the power of spatial analysis in science and problem solving. Students move through progressively challenging activities that encourage spatial thinking and using a process of feedback and inquiry to ask and answer spatially and temporally related environmental questions.
(Note: this resource was added to OER Commons as part of a batch upload of over 2,200 records. If you notice an issue with the quality of the metadata, please let us know by using the 'report' button and we will flag it for consideration.)
Students use a spreadsheet to compute the hypothetical risk of an Andrew-like hurricane to downtown Miami.
This is an activity that uses the spreadsheet program Excel to explore the origins of subsidence in New Orleans. There are two versions. The first is a traditional Spreadsheets Across the Curriculum (SSAC) module that couples a PowerPoint presentation with an embedded Excel spreadsheet where students construct a spreadsheet, and then submit the Excel file for grading. The second is a macro-enabled Excel spreadsheet that provides automatic feedback to answers and calculates the score. Upon completion the students are given a code that encrypts their spreadsheet score and then take a follow-up quiz that probes their understanding.
(Note: this resource was added to OER Commons as part of a batch upload of over 2,200 records. If you notice an issue with the quality of the metadata, please let us know by using the 'report' button and we will flag it for consideration.)
Students use spreadsheets to analyze the reasons why New Orleans has subsided in the past 250 years.
Students learn about tsunami vertical evacuation structures (TVES) as a viable solution for communities with high ground too far away for rapid evacuation. Students then apply basic design principles for TVES and make their own scale model that they think would fit will in their target community. Activity has great scope for both technical and creative design as well as practical application of math skills. Examples are from the Pacific Northwest, USA's most tsunami-vulnerable communities away from high ground, but it could be adapted to any region with similar vulnerability.
(Note: this resource was added to OER Commons as part of a batch upload of over 2,200 records. If you notice an issue with the quality of the metadata, please let us know by using the 'report' button and we will flag it for consideration.)
Introductory lesson that contextualizes how multiple instruments provide a more complete picture on an event.
(Note: this resource was added to OER Commons as part of a batch upload of over 2,200 records. If you notice an issue with the quality of the metadata, please let us know by using the 'report' button and we will flag it for consideration.)