Updating search results...

Search Resources

144 Results

View
Selected filters:
  • earthquakes
Investigating Factors That Affect Tsunami Inundation
Conditional Remix & Share Permitted
CC BY-NC-SA
Rating
0.0 stars

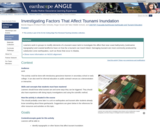
Learners modify elements of a tsunami wave tank to investigate the affect that near-coast bathymetry (submarine topography) and coastal landforms have on how far a tsunami can travel inland. Damaging tsunami are most commonly produced by subduction zone earthquakes, such as those that occur in Alaska.

(Note: this resource was added to OER Commons as part of a batch upload of over 2,200 records. If you notice an issue with the quality of the metadata, please let us know by using the 'report' button and we will flag it for consideration.)
Subject:
Biology
Life Science
Mathematics
Measurement and Data
Statistics and Probability
Material Type:
Activity/Lab
Homework/Assignment
Provider:
Science Education Resource Center (SERC) at Carleton College
Provider Set:
Teach the Earth
Author:
Bonnie Magura (Portland Public Schools), Roger Groom (Mt Tabor Middle School), and CEETEP (Cascadia EarthScope Earthquake and Tsunami Education Program)
Date Added:
09/26/2022
Is the New Madrid Seismic Zone at risk for a large earthquake?
Conditional Remix & Share Permitted
CC BY-NC-SA
Rating
0.0 stars

Students do background reading on the possible origins of intraplate seismicity and also read Nuttli's 1973 paper on the 1811-1812 New Madrid sequence. They construct frequency magnitude diagrams using data they acquire themselves from the openly archived University of Memphis catalog, Southern California Earthquake Center catalog, and USGS global catalog. They use these diagrams to estimate a recurrence interval for large magnitude earthquakes at the NMSZ. They then split into teams to read papers detailing campaign GPS surveys, paleoseismic measurements, and heat flow measurements. Each team is responsible for summarizing their set of papers for the other students. The culminating assignment is to update Gomberg and Schweig's 2002 USGS pamphlet "Earthquake hazard in the heart of the homeland" using scientific results that postdate the original pamphlet (including their own analysis). We also end with a "teaching and learning discussion" in which the students, who are usually high school teachers themselves, trade ideas about how they could repurpose parts of the lesson for use in their own classrooms. This activity gives students practice in data analysis and reading scientific papers, it shows them a few resources where they can find openly available data, and it gives them a chance to participate in the practice of science.
Teaching Tips
Adaptations that allow this activity to be successful in an online environment
This lesson was constructed specifically for an online course and didn't exist beforehand. I think it could work in a face-to-face course, too.
Elements of this activity that are most effective
Students,especially ones who are not as literate with software plotting / analysis programs, find the problem set somewhat difficult because the datasets are large and I am asking them to collect the data themselves, then use it to make a second-order plot and analyze that, instead of just plotting "A" vs. "B" and analyzing it.

That being said, I know that students are excited to be able to produce a plot themselves that exactly mimics one they can find in a published paper, and furthermore they are happy to find resources such as the USGS earthquake catalog that contain available real-time data.

The part where they have to compare and contrast the strengths and weaknesses of each technique used to study the NMSZ (seismology, paleoseismology, GPS, etc) is important because they get a real sense of how different approaches are important to resolve a scientific debate. I know they are learning something when they get frustrated because there isn't an easy answer!
Recommendations for other faculty adapting this activity to their own course:
-Be prepared to help students get through the technical aspects of some of the scientific papers, especially if they are not used to reading scientific papers. When I pick the papers for them to read, I purposely pick ones that aren't too long (Science, Nature, GRL, etc) and I try to pick ones that came with a press release, "news and views" or similar, and then I tell the students to read the press release first and then the paper.

-Be prepared to give students hints about counting and sorting data to make the frequency-magnitude diagrams because you'd rather lead them towards how to make the plots and then let them get on with the analysis as opposed to letting them get so frustrated with their lack of technical skills that they aren't interested in the science anymore. This exercise should be about seismology; it shouldn't be an excel tutorial! I have a little set of screen capture movie how-to hints under a hidden url, and when I can tell that a student is really suffering I reveal them.

(Note: this resource was added to OER Commons as part of a batch upload of over 2,200 records. If you notice an issue with the quality of the metadata, please let us know by using the 'report' button and we will flag it for consideration.)
Subject:
Biology
Life Science
Mathematics
Measurement and Data
Statistics and Probability
Material Type:
Activity/Lab
Provider:
Science Education Resource Center (SERC) at Carleton College
Provider Set:
Teach the Earth
Author:
Eliza Richardson
Date Added:
12/11/2020
Izmit Earthquake
Conditional Remix & Share Permitted
CC BY-NC-SA
Rating
0.0 stars

This lab allows students to look at variety of data from the North Anatolian fault in Turkey. Specifically, students have the oportunity to:

interpret seismograms from the Izmit earthquake in 1999 (while accessing some seismograph station information from IRIS)
make and interpret an earthquake focal mechanism solution based on these seismograms
locate the earthquake epicenter
calculate the moment magnitude of the earthquake using published data showing epicenter locations and displacement measurements
intepret historical data from the North Anatolian fault and tectonic-scale plate motion information to see what patterns occur in the regional seismicity.

(Note: this resource was added to OER Commons as part of a batch upload of over 2,200 records. If you notice an issue with the quality of the metadata, please let us know by using the 'report' button and we will flag it for consideration.)
Subject:
Biology
Geology
Life Science
Mathematics
Measurement and Data
Physical Science
Statistics and Probability
Material Type:
Activity/Lab
Provider:
Science Education Resource Center (SERC) at Carleton College
Provider Set:
Teach the Earth
Author:
Sarah Titus
Date Added:
09/05/2020
A Kinesthetic Demonstration for Locating Earthquake Epicenters
Conditional Remix & Share Permitted
CC BY-NC-SA
Rating
0.0 stars

This activity has students bodily move as propagating seismic waves. They record their travel time along a string of measured length to compute average wave velocities. They then enact an earthquake, and use the time lag between wave arrival times and their computed speeds to determine the position of the epicenter.

(Note: this resource was added to OER Commons as part of a batch upload of over 2,200 records. If you notice an issue with the quality of the metadata, please let us know by using the 'report' button and we will flag it for consideration.)
Subject:
Biology
Life Science
Material Type:
Activity/Lab
Provider:
Science Education Resource Center (SERC) at Carleton College
Provider Set:
Teach the Earth
Author:
John Keyantash
Date Added:
08/12/2019
Laboratory Manual for Introductory Geology
Conditional Remix & Share Permitted
CC BY-SA
Rating
0.0 stars

This textbook is a comprehensive lab manual for the core curriculum Introductory Geosciences classes with both informational content and laboratory exercises. Topics include basic laws and theories in Geology, the Earth's interior and plate tectonics, water and climate change, igneous rocks and volcanoes, and earthquakes.

Subject:
Geology
Physical Science
Material Type:
Textbook
Provider:
University System of Georgia
Provider Set:
Galileo Open Learning Materials
Author:
Bradley Deline
Karen Tefend
Randa Harris
Date Added:
09/23/2015
Let's Look Inside the Earth
Conditional Remix & Share Permitted
CC BY-NC-SA
Rating
0.0 stars

Students will analyze USGS seismology data in the classroom using spreadsheets and scatter plots to look for patterns and structure in the Earth's crust. Before analyzing data, students will learn about the methods scientists use to gather seismic data. They will explore plate tectonics, plate boundaries, and volcanoes using Google Earth. The teacher will provide demonstrations on the types of faults and how earthquakes propagate and travel through the earth.

(Note: this resource was added to OER Commons as part of a batch upload of over 2,200 records. If you notice an issue with the quality of the metadata, please let us know by using the 'report' button and we will flag it for consideration.)
Subject:
Biology
Life Science
Material Type:
Activity/Lab
Provider:
Science Education Resource Center (SERC) at Carleton College
Provider Set:
Teach the Earth
Author:
David Zelenka
Date Added:
12/23/2020
Liquefaction Live! activity
Conditional Remix & Share Permitted
CC BY-NC-SA
Rating
0.0 stars

This activity is done after students have completed or are in the process of completing reading and lectures on ground water flow, earthquakes, and geologic hazards. In class, students receive all the materials necessary to complete the activity, along with worksheets that contain instructions and questions that need to be answered. Their task is to make predictions, execute the activities, and comment on what the outcomes.

(Note: this resource was added to OER Commons as part of a batch upload of over 2,200 records. If you notice an issue with the quality of the metadata, please let us know by using the 'report' button and we will flag it for consideration.)
Subject:
Biology
Life Science
Material Type:
Activity/Lab
Provider:
Science Education Resource Center (SERC) at Carleton College
Provider Set:
Teach the Earth
Author:
Maggie Zimmerman
Date Added:
08/11/2019
Locating and Measuring Earthquakes Using Real Seismic Data
Conditional Remix & Share Permitted
CC BY-NC-SA
Rating
0.0 stars

Your objective is to locate an earthquake and measure its Richter magnitude using real data recorded by seismographs.

Step one: Point your web browser to Virtual Earthquake to start
Step two: Read the instructions on that page, select an earthquake, and click on Submit Choice.
Step three: View the seismograms, measure S-P intervals, convert them, determine the distances from the earthquake to the 3 stations using a chart provided on the page, and compare your results with the real epicenter. If you get an "Ooops" or "you are close". you have to re-measure the S-P intervals and the distances.
Step four: After the earthquake is located, go on to determine its Richter magnitude.
Step five: Get yourself certificated as a "Virtual Seismologist". Print out the page which contains the Certificate and the Final Data Summary that shows what you have entered. Turn in this page with your name and ID at the top to receiver credit.

Uses online and/or real-time data
Has minimal/no quantitative component

(Note: this resource was added to OER Commons as part of a batch upload of over 2,200 records. If you notice an issue with the quality of the metadata, please let us know by using the 'report' button and we will flag it for consideration.)
Subject:
Biology
Life Science
Material Type:
Activity/Lab
Provider:
Science Education Resource Center (SERC) at Carleton College
Provider Set:
Teach the Earth
Author:
Kelly Liu
Date Added:
09/05/2019
Making Community Connections to Co-learn about Earthquakes
Conditional Remix & Share Permitted
CC BY-NC-SA
Rating
0.0 stars

Many people live in regions prone to earthquakes, tsunamis and volcanic eruptions, but the hazards and risks inherent in our communities may be very different. Making connections with learners from another location is a great way to share knowledge and practice science communication skills. Video conferencing applications like Zoom and Skype make it possible to connect with learners anywhere in the world. This activity provides a simple protocol, and a form for submitting a request to connect with a classroom teacher in Anchorage, Alaska.

(Note: this resource was added to OER Commons as part of a batch upload of over 2,200 records. If you notice an issue with the quality of the metadata, please let us know by using the 'report' button and we will flag it for consideration.)
Subject:
Biology
Life Science
Mathematics
Measurement and Data
Statistics and Probability
Material Type:
Activity/Lab
Homework/Assignment
Provider:
Science Education Resource Center (SERC) at Carleton College
Provider Set:
Teach the Earth
Author:
Jennifer Pickering
Date Added:
08/12/2022
Mercalli Earthquake Activity
Conditional Remix & Share Permitted
CC BY-NC-SA
Rating
0.0 stars

This activity is an inquiry approach to term and concept introduction. Students will work in a jigsaw format to read through the descriptions of eyewitness accounts from earthquakes and assess a Mercalli value. In the jigsaw groups, they will compare the different Mercalli and Richter values and describe the basic events that occurred during different earthquakes. They will share this information in order to collaboratively assess the strengths and weaknesses of this scale relative to the Richter magnitudes provided. They will also begin to determine what types of hazards result from earthquakes.

(Note: this resource was added to OER Commons as part of a batch upload of over 2,200 records. If you notice an issue with the quality of the metadata, please let us know by using the 'report' button and we will flag it for consideration.)
Subject:
Biology
Life Science
Material Type:
Activity/Lab
Provider:
Science Education Resource Center (SERC) at Carleton College
Provider Set:
Teach the Earth
Author:
Kaatje van der Hoeven Kraft
Date Added:
09/20/2022
Mysterious motions along the Pacific Northwest Coast
Conditional Remix & Share Permitted
CC BY-NC-SA
Rating
0.0 stars

Students work in small groups to analyze and interpret Global Positioning System (GPS) and seismic data related to "mysterious ground motions" first along the northern California coastline, and then in British Columbia. This activity emphasizes the analysis and synthesis of multiple types of data and introduces a mode of fault behavior known as Episodic Tremor and Slip (ETS).

Subject:
Geology
Physical Science
Material Type:
Activity/Lab
Provider:
Science Education Resource Center (SERC) at Carleton College
Provider Set:
Teach the Earth
Author:
John Taber
Date Added:
01/20/2023
Natural Hazards on the Island of Hawaii
Conditional Remix & Share Permitted
CC BY-NC-SA
Rating
0.0 stars

In this jigsaw activity, students discover four different aspects of natural hazards on the Island of Hawaii. The goal for students is to design a hazard zone map that combines these four topics and that could be used for making land-use decisions before future natural hazards occur. Students will first be assigned to one of four Hazard Specialties (lava flows, explosive eruptions, earthquakes, tsunami), where they complete an exercise and make a preliminary hazard zone map with their specialty group from a single hazard map. Then the students will reorganize into Hazard Assessment Teams, with one student from each of the four Hazard Specialties, to develop a final hazard zone map based on information on all four hazards. Each Hazard Assessment Team will make a recommendation about the risks of natural hazards to existing and future development in Hilo, Kailua-Kona, and Kalapana on the Island of Hawaii.

(Note: this resource was added to OER Commons as part of a batch upload of over 2,200 records. If you notice an issue with the quality of the metadata, please let us know by using the 'report' button and we will flag it for consideration.)
Subject:
Biology
Life Science
Material Type:
Activity/Lab
Provider:
Science Education Resource Center (SERC) at Carleton College
Provider Set:
Teach the Earth
Author:
Andrew Greene
Date Added:
08/31/2019
Natural Hazards on the Island of Hawaiâi
Conditional Remix & Share Permitted
CC BY-NC-SA
Rating
0.0 stars

In this jigsaw activity, students discover four different aspects of natural hazards on the Island of Hawaii. The goal for students is to design a hazard zone map that combines these four topics and that could be used for making land-use decisions before future natural hazards occur.

Students will first be assigned to one of four Hazard Specialties (lava flows, explosive eruptions, earthquakes, tsunami), where they complete an exercise and make a preliminary hazard zone map with their specialty group from a single hazard map.
Then the students will reorganize into Hazard Assessment Teams, with one student from each of the four Hazard Specialties, to develop a final hazard zone map based on information on all four hazards. Each Hazard Assessment Team will make a recommendation about the risks of natural hazards to existing and future development in Hilo, Kailua-Kona, and Kalapana on the Island of Hawaii.

(Note: this resource was added to OER Commons as part of a batch upload of over 2,200 records. If you notice an issue with the quality of the metadata, please let us know by using the 'report' button and we will flag it for consideration.)
Subject:
Biology
Life Science
Material Type:
Activity/Lab
Provider:
Science Education Resource Center (SERC) at Carleton College
Provider Set:
Teach the Earth
Author:
Andrew Greene
Michael Garcia
Michael Poland
Date Added:
08/21/2019
Our Changing Earth: Virtual Bookshelf
Conditional Remix & Share Permitted
CC BY-SA
Rating
0.0 stars

This article features children's literature about erosion, glaciers, earthquakes, and volcanoes for use in the elementary classroom.

Subject:
Applied Science
Environmental Science
Material Type:
Lesson Plan
Provider:
Ohio State University College of Education and Human Ecology
Provider Set:
Beyond Penguins and Polar Bears: An Online Magazine for K-5 Teachers
Author:
Kate Hastings
Date Added:
10/17/2014
Pasta Quake: Exploring Earthquake Magnitude
Conditional Remix & Share Permitted
CC BY-NC-SA
Rating
0.0 stars

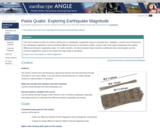
This short activity provides an intuitive introduction to earthquake magnitude using an everyday item--spaghetti. Learners are introduced to the earthquake magnitude scale by breaking different amounts of uncooked noodles. Visual scale of the pasta emphasizes the relative differences between magnitudes with each whole step in magnitude. For older students, the demonstration helps students understand why seismologists use the nonlinear logarithmic scale to best graph the huge range of quantities.

(Note: this resource was added to OER Commons as part of a batch upload of over 2,200 records. If you notice an issue with the quality of the metadata, please let us know by using the 'report' button and we will flag it for consideration.)
Subject:
Biology
Life Science
Mathematics
Measurement and Data
Statistics and Probability
Material Type:
Activity/Lab
Homework/Assignment
Provider:
Science Education Resource Center (SERC) at Carleton College
Provider Set:
Teach the Earth
Author:
Paul Doherty (Exploratorium Teacher Institute) and Roger Groom (Mt Tabor Middle School) with improvements by ShakeAlert
Date Added:
09/26/2022
Perspectives on Ocean Science: Shake, Rattle, and Roll - The Physics of Earthquakes
Read the Fine Print
Rating
0.0 stars

Join oceanographer Kevin Brown as he describes the phenomena that we experience as "earthquakes" and relates what scientists understand about the physics of these sudden and at times catastrophic movements in the earthŐs crust. Learn how Brown and other Scripps scientists are using a variety of techniques to better understand when, where, and how earthquakes occur. (50 minutes)

Subject:
Geology
Physical Science
Physics
Material Type:
Lecture
Provider:
UCTV Teacher's Pet
Date Added:
03/12/2012
Perspectives on Ocean Science: Unraveling the Secrets of the Southern San Andreas Fault
Read the Fine Print
Rating
0.0 stars

The southern San Andreas Fault in California has not had a large earthquake in approximately 300 years, yet the average recurrence interval for the previous five ruptures is about 180 years. Join Scripps Oceanography geoscientist Neal Driscoll as he presents new findings on a possible relationship between these earthquakes and the flooding of Lake Cahuilla, which forms episodically as the Colorado River switches course and flows north into the Salton Trough. Learn how new data on the timing and magnitude of past earthquakes are being used to assess the potential for large earthquakes in the region. (58 minutes)

Subject:
Geology
Physical Science
Material Type:
Lecture
Provider:
UCTV Teacher's Pet
Date Added:
03/12/2012
Physical Geology, First University of Saskatchewan Edition
Conditional Remix & Share Permitted
CC BY-NC-SA
Rating
0.0 stars

Physical Geology is a comprehensive introductory text on the physical aspects of geology, including rocks and minerals, plate tectonics, earthquakes, volcanoes, mass wasting, climate change, planetary geology and much more. It has a strong emphasis on examples from western Canada. It is adapted from "Physical Geology" written by Steven Earle for the BCcampus Open Textbook Program. To access links to download PDF files, click the Read Book button below.

Subject:
Geology
Physical Science
Material Type:
Textbook
Provider:
University of Saskatchewan
Author:
Karla Panchuk
Date Added:
03/26/2019
The Plate Boundary Fault of the 2011 Tohoku Earthquake: Oceanic Provenance and Earthquake Genesis
Conditional Remix & Share Permitted
CC BY-NC-SA
Rating
0.0 stars

This is one component of the Seismogenic zone Experiment Mini Lessons
This mini lesson provides an example of how stratigraphy influences tectonics, and vice versa. The magnitude 9 Tohoku earthquake slipped a record 50m along a plate boundary fault comprised of extraordinarily weak smectite-rich pelagic clay [Chester et al., 2013; Ujiie et al., 2013, Fulton et al., 2013]. This clay may also have served as a slip surface for numerous large tsunami and tsunamigenic earthquakes along the subduction zone to the northeast, but it facilitated none along the Japan and Izu-Bonin Trenches to the south. During this lesson students will discover the probable reasons for this dichotomy.
Students will be supplied with locations of the Tohoku earthquake ocean drilling site (C0019) and the reference Site (436) as they are back tracked through Pacific Plate motions to their locations of origin. Students will construct the vertical sedimentary sequence that would occur, using Walther's Law (Prothero and Schwab, 1996, p. 329-330).

The student-reconstructed vertical sequence of sedimentary deposits will be compared to that at IODP Site 436. Site 436 includes a conspicuous interval of pelagic clay and is the oceanic reference site for Site C0019 drilled during Exp. 343. Students will compare the vertical succession of sediment lithologies hypothetically accumulated in their backtracked site to those observed at Sites 436, C0019 and others on the oceanic plate incoming to the subduction zone. Students will learn that smooth seafloor correlates with continuity of the pelagic clay layer, whereas, areas of rough seafloor (containing seamounts capped with carbonate and siliceous pelagic sediments) correlate with discontinuity of the pelagic clay layer. They will also learn that large earthquakes and tsunamis occur only in areas of more continuous incoming pelagic clay. Students will be able to speculate on the role of seamounts in interruption of the propagation of seismic slip (e.g. Wang and Bilek, 2011, 2014).

Subject:
Geology
Physical Geography
Physical Science
Material Type:
Activity/Lab
Provider:
Science Education Resource Center (SERC) at Carleton College
Provider Set:
Teach the Earth
Author:
(James) Casey Moore
Date Added:
01/20/2023