Updating search results...

Search Resources

106 Results

View
Selected filters:
  • geophysics
Sonar Demonstration -- Human Sound Wave
Conditional Remix & Share Permitted
CC BY-NC-SA
Rating
0.0 stars

Sonar technology allowed scientists to produce high-resolution maps of the sea floor for the first time. This sonar demonstration uses a Human Sound Wave to image the "sea floor" in a lecture hall. In doing so, students can see two-way travel times collected and plotted in real time. Students also evaluate sources of error that can be applied to a real sonar device.

(Note: this resource was added to OER Commons as part of a batch upload of over 2,200 records. If you notice an issue with the quality of the metadata, please let us know by using the 'report' button and we will flag it for consideration.)

Subject:
Biology
Geology
Life Science
Mathematics
Measurement and Data
Physical Science
Statistics and Probability
Material Type:
Activity/Lab
Simulation
Provider:
Science Education Resource Center (SERC) at Carleton College
Provider Set:
Teach the Earth
Author:
Kent Syverson
Date Added:
09/03/2019
Taking the Pulse of Yellowstone's "Breathing" Volcano
Conditional Remix & Share Permitted
CC BY-NC-SA
Rating
0.0 stars

In this activity, students learn about volcanism in Yellowstone National Park, focusing on its history of eruption, recent seismicity, hydrothermal events, and ground deformation. They learn how scientists monitor volcanoes (using Mount St. Helens as an example) and then apply that as an open-ended problem to Yellowstone; their problem is to identify a site for a research station.

(Note: this resource was added to OER Commons as part of a batch upload of over 2,200 records. If you notice an issue with the quality of the metadata, please let us know by using the 'report' button and we will flag it for consideration.)
Subject:
Biology
Life Science
Physical Science
Physics
Material Type:
Activity/Lab
Provider:
Science Education Resource Center (SERC) at Carleton College
Provider Set:
Teach the Earth
Author:
Beth Pratt-Sitaula
Date Added:
02/02/2022
Tectonic Plates, Earthquakes, and Volcanoes
Read the Fine Print
Educational Use
Rating
0.0 stars

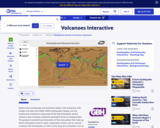
This interactive activity produced for Teachers' Domain shows the relationship between tectonic boundaries and the locations of earthquake events and volcanoes around the world.

Subject:
Astronomy
Chemistry
Education
Geology
Geoscience
Physical Science
Physics
Space Science
Material Type:
Activity/Lab
Data Set
Diagram/Illustration
Interactive
Provider:
PBS LearningMedia
Provider Set:
PBS Learning Media: Multimedia Resources for the Classroom and Professional Development
Author:
National Science Foundation
WGBH Educational Foundation
Date Added:
12/17/2005
Three-Point Problem by Simultaneous Linear Equations
Conditional Remix & Share Permitted
CC BY-NC-SA
Rating
0.0 stars

Students are introduced to the use of linear algebra in an intuitive and accessible way, through classroom activity and homework set. The familiar three-point problem is cast in terms of three dimensional analytic geometry, fostering understanding of mathematical models for simple geometric forms.

(Note: this resource was added to OER Commons as part of a batch upload of over 2,200 records. If you notice an issue with the quality of the metadata, please let us know by using the 'report' button and we will flag it for consideration.)
Subject:
Biology
Geology
Geoscience
Life Science
Mathematics
Measurement and Data
Physical Science
Statistics and Probability
Material Type:
Activity/Lab
Provider:
Science Education Resource Center (SERC) at Carleton College
Provider Set:
Teach the Earth
Author:
William Frangos
Date Added:
08/28/2019
Topics in Fluid Dynamics
Conditional Remix & Share Permitted
CC BY-NC-SA
Rating
0.0 stars

This resource presents a collection of essays developed from the author's experience teaching the course Fluid Dynamics of the Atmosphere and Ocean, offered to graduate students entering the MIT/WHOI Joint Program in Oceanography. The collection includes the following three essays:
Essay 1: Lagrangian and Eulerian Representations of Fluid Flow (revised and expanded in 2024)

Part 1: Kinematics and the Equations of Motion
Part 2: Advection of Parcels and Fields

Essay 2: Dimensional Analysis of Models and Data Sets: Similarity Solutions and Scaling Analysis
Essay 3: A Coriolis Tutorial (revised and expanded in 2023)

Part 1: The Coriolis Force, Inertial and Geostrophic Motion
Part 2: A Rotating Shallow Water Model and Geostrophic Adjustment
Part 3: Beta Effects and Western Propagation
Part 4: Wind-Driven Ocean Circulation and the Sverdrup Relation
Part 5: On the Seasonally-Varying Circulation of the Arabian Sea

The goal of this resource is to help each student master the concepts and mathematical tools that make up the foundation of classical and geophysical fluid dynamics. These essays treat these topics in considerably greater depth than a comprehensive fluids textbook can afford, and they are accompanied by data files (MATLAB® and Fortran) to allow some application and experimentation. They should be suitable for self-study.

Subject:
Applied Science
Atmospheric Science
Engineering
Oceanography
Physical Science
Physics
Material Type:
Full Course
Provider:
MIT
Provider Set:
MIT OpenCourseWare
Author:
Price, James
Date Added:
09/01/2023
Tsunami assignment
Conditional Remix & Share Permitted
CC BY-NC-SA
Rating
0.0 stars

Lectures and previous brief assignments dealt with plate tectonics, earthquakes, volcanoes and tsunamis. For the assignment, students read several articles describing potential sources for tsunamis on the east coast, including volcanic eruptions on the Canary Islands, underwater landslides off the shelf, and earthquakes. Their task is to summarize these potential sources, evaluate the risk of a tsunami on the east coast, and compare them with previously discussed risks for the west coast and Hawaii.

(Note: this resource was added to OER Commons as part of a batch upload of over 2,200 records. If you notice an issue with the quality of the metadata, please let us know by using the 'report' button and we will flag it for consideration.)

Subject:
Biology
Geology
Life Science
Physical Science
Material Type:
Homework/Assignment
Provider:
Science Education Resource Center (SERC) at Carleton College
Provider Set:
Teach the Earth
Author:
Klaus Neumann
Date Added:
08/23/2019
Unit 2: Global Sea-Level Response to Temperature Changes: Temperature and Altimetry Data
Conditional Remix & Share Permitted
CC BY-NC-SA
Rating
0.0 stars

What is the contribution of seawater thermal expansion to recent sea-level rise? In this unit, students create time-series graphs of global averaged sea surface temperature anomaly (SSTA) data spanning 1880 -- 2017 and conduct linear trend analysis to assess SST change during this period. Based on the calculated SST change, students calculate how much sea-level rise occurred during 1993 -- 2015 due to thermal expansion of the oceans. Students compare their thermal expansion calculated sea-level rise results to observed sea-level rise from radar altimetry and assess how much sea-level rise is attributable to thermal expansion.

Show more about Online Teaching suggestions
Hide
Online-ready: The exercise is electronic and could be done individually or in small online groups. Lecture is best done synchronously due to the technical nature. Discussion would be better that way too.

(Note: this resource was added to OER Commons as part of a batch upload of over 2,200 records. If you notice an issue with the quality of the metadata, please let us know by using the 'report' button and we will flag it for consideration.)

Subject:
Applied Science
Biology
Environmental Science
Life Science
Mathematics
Measurement and Data
Statistics and Probability
Material Type:
Activity/Lab
Module
Provider:
Science Education Resource Center (SERC) at Carleton College
Provider Set:
Teach the Earth
Author:
Bruce Douglas
Susan Kaspari
Date Added:
01/04/2022
Unit 3: Global Sea-Level Response to Ice Mass Loss: GRACE and InSAR data
Conditional Remix & Share Permitted
CC BY-NC-SA
Rating
0.0 stars

What is the contribution of melting ice sheets compared to other sources of sea-level rise? How much is the sea level projected to increase during the twenty-first century? In this unit students will use Gravity Recovery and Climate Experiment (GRACE) ice-mass loss time series from Greenland and Antarctica to calculate sea-level rise due to the addition of freshwater inputs from melting ice sheets, and use Interferometric Synthetic Aperture Radar (InSAR) ice-velocity data to extrapolate which regions of the ice sheets are losing the greatest mass. Sea-level rise from melting ice sheets is then contrasted to the other dominant causes of sea-level rise, including thermal expansion, melting glaciers, and changes in land water storage. Lastly, students will extrapolate how much sea-level rise will occur by year 2100 based on recent observed rates of sea-level rise and compare these values to sea-level rise projections from the Intergovernmental Panel on Climate Change.

Show more about Online Teaching suggestions
Hide
Online-ready: The exercise is electronic and could be done individually or in small online groups. Lecture is best done synchronously due to the technical nature. Discussion would be better that way too.

(Note: this resource was added to OER Commons as part of a batch upload of over 2,200 records. If you notice an issue with the quality of the metadata, please let us know by using the 'report' button and we will flag it for consideration.)
Subject:
Applied Science
Biology
Career and Technical Education
Environmental Science
Environmental Studies
Geology
Life Science
Mathematics
Measurement and Data
Physical Science
Statistics and Probability
Material Type:
Activity/Lab
Module
Provider:
Science Education Resource Center (SERC) at Carleton College
Provider Set:
Teach the Earth
Author:
Bruce Douglas
Susan Kaspari
Date Added:
09/26/2022
Unit 4: Measuring Ice Mass Changes: Vertical Bedrock GPS
Conditional Remix & Share Permitted
CC BY-NC-SA
Rating
0.0 stars

This unit shows how GPS records of bedrock surface elevation may be used to monitor snow and ice loading/unloading on decadal and annual time scales. Students calculate secular trends in the GPS time series and then use the original and detrended records to identify sites that exhibit similar behavior. Students gain experience with the challenges and benefits of using bedrock geodetic data to study snow and ice mass changes. They also consider the magnitude and timing of the elastic component of vertical change compared to that associated with post-glacial rebound (viscoelastic response).

Show more information on GPS versus GNSS
Hide
Note: Although the term GPS (Global Positioning System) is more commonly used in everyday language, it officially refers only to the USA's constellation of satellites. GNSS (Global Navigation Satellite System) is a universal term that refers to all satellite navigation systems including those from the USA (GPS), Russia (GLONASS), European Union (Galileo), China (BeiDou), and others. In this module, we use the term GPS even though, technically, some of the data may be coming from satellites in other systems.

Show more about Online Teaching suggestions
Hide
Online-ready: The exercise is electronic and could be done individually or in small online groups. Lecture is best done synchronously due to the technical nature. Discussion would be better that way too.

(Note: this resource was added to OER Commons as part of a batch upload of over 2,200 records. If you notice an issue with the quality of the metadata, please let us know by using the 'report' button and we will flag it for consideration.)
Subject:
Applied Science
Biology
Environmental Science
Life Science
Mathematics
Measurement and Data
Statistics and Probability
Material Type:
Activity/Lab
Module
Provider:
Science Education Resource Center (SERC) at Carleton College
Provider Set:
Teach the Earth
Author:
Bruce Douglas
Susan Kaspari
Date Added:
03/01/2022
Unit 5: Societal Implications of Climate Change: Stakeholder Report
Conditional Remix & Share Permitted
CC BY-NC-SA
Rating
0.0 stars

Sea-level rise due to the melting of glaciers and ice sheets and ocean thermal expansion has significant societal and economic consequences. In this final unit, students prepare a summary of the impacts of sea level for relevant stakeholders. Students will integrate the stakeholder analysis in Unit 1 with the geodetic data (radar satellite altimetry, GRACE [Gravity Recovery and Climate Experiment], InSAR, and GPS) of ice mass loss and sea-level rise from Units 2 -- 4 in their analysis. Unit 5 is the summative assessment for the module.

Show more about Online Teaching suggestions
Hide
Online-ready: The exercise is a final project that can be done remotely, individually or in small online groups.

(Note: this resource was added to OER Commons as part of a batch upload of over 2,200 records. If you notice an issue with the quality of the metadata, please let us know by using the 'report' button and we will flag it for consideration.)
Subject:
Applied Science
Biology
Career and Technical Education
Environmental Science
Environmental Studies
Geology
Life Science
Physical Science
Material Type:
Activity/Lab
Module
Provider:
Science Education Resource Center (SERC) at Carleton College
Provider Set:
Teach the Earth
Author:
Bruce Douglas
Susan Kaspari
Date Added:
03/01/2022
Upper Cenozoic Geologic Map, Yellowstone Plateau Volcanic Field
Unrestricted Use
Public Domain
Rating
0.0 stars

This geologic map shows Tertiary and Quaternary rock formations, volcanic and surficial deposits, faults, contacts, and other geologic features in Yellowstone National Park. The map is freely downloadable as a PDF file.

Subject:
Geoscience
Physical Science
Physics
Material Type:
Diagram/Illustration
Provider:
Science Education Resource Center (SERC) at Carleton College
Provider Set:
Teach the Earth
Author:
Christiansen Robert
U.S. Geological Survey
Date Added:
11/07/2014
Using Satellite Data and Google Earth to Explore the Shape of Ocean Basins and Bathymetry of the Sea Floor
Conditional Remix & Share Permitted
CC BY-NC-SA
Rating
0.0 stars

This activity is for an introductory oceanography course. It is designed to allow students to use various tools (satellite images, Google Earth) to explore the shape of the sea floor and ocean basins in order to gain a better understanding of both the processes that form ocean basins, as well as how the shape of ocean basins influences physical and biological processes.

(Note: this resource was added to OER Commons as part of a batch upload of over 2,200 records. If you notice an issue with the quality of the metadata, please let us know by using the 'report' button and we will flag it for consideration.)
Subject:
Biology
Geology
Geoscience
Life Science
Mathematics
Measurement and Data
Physical Science
Material Type:
Activity/Lab
Data Set
Lesson Plan
Provider:
Science Education Resource Center (SERC) at Carleton College
Provider Set:
Teach the Earth
Author:
Molly Palmer
Date Added:
12/11/2019
VEPP: Using volcano deformation data for lava flow hazard assessment and decision making, Part I: what do the instruments measure?
Conditional Remix & Share Permitted
CC BY-NC-SA
Rating
0.0 stars

This is an exercise that is in development and has not yet been fully tested in the classroom. Please check back regularly for updates and changes.

Brief three-line description of the activity or assignment and its strengths:
This is the first part of a loosely linked three part activity. Each part can be used as a stand-alone activity with slight modification. This part introduces students to volcano monitoring using data from tiltmeters and GPS receivers by means of a very simple in-class demonstration of volcanic inflation/deflation, followed by small group discussion of real data and their implications, followed by individual homework assignment based on VEPP data interpretation
Full length description:

The instructor conducts the in-class demonstration described below (demonstration takes about 20 minutes):

Put the wet sand in the tray (fill up to about three-quarters of the tray depth)
Bury the balloon in the sand. Attach the pump to the balloon.
Shape the sand above the balloon to mimic a volcano.
The balloon is the model of the magma chamber inside the volcano. While it stays relatively deflated, the "volcano" above it shows no major change in shape.
Air is then pumped in the balloon, mimicking an infusion of magma in the magma chamber. As the balloon begins to fill out, it expands, deforming the volcano above it.
The volcano is now "active" and should be "monitored" by different instruments, namely, tiltmeters, GPS, and seismometers. The carpenters' levels mimic "tiltmeters." At this point it might be useful to ask the students to select where the tiltmeters should be placed, making sure one is "tangential" and the other is "radial" (perpendicular to each other). This is a good place to start a discussion about inflation and deflation events and how those are measured by tiltmeters.
Once there is enough air in the balloon to create an obvious bulge in the volcano, the use of GPS receivers for measuring volcano deformation can be discussed. Two long pins can be used as two GPS stations and the changing distance between them can demonstrate how deformation can be measured in 3-D. At this point, several inflation-deflation events can be demonstrated by carefully letting air out of the balloon and pumping it back in.
This demonstration introduces different geophysical instruments used for volcano monitoring and provides a simplified illustration of how they work.
This demonstration is followed by a brief overview of the VEPP website and the type of data available there.
Whole class discussion about different data types (example: inflation-deflation events as recorded by tiltmeters over a specific time period). Instructor will lead the discussion and demonstrate how the data is manipulated on-line.

The VEPP overview takes 10-15 minutes
After the whole class discussion and demonstration by instructor, students break into small groups (3-4 people per group). Instructor provides printed data plots for tiltmeters and GPS time series for the same time period. A map showing the locations of the corresponding instruments is also provided. Different groups get data for different time periods/eruption events. An example plot with clearly marked inflation/deflation events and instructions about how to read the plots will be helpful
Questions for students to answer in small groups:

Identify the dates/times when tiltmeters record inflation events
Identify dates/times when tiltmeters record deflation events
What does the GPS data show for each of those time periods?
What can you infer about the volcanic activity for those time periods from the data provided?

Small group discussion takes 15-20 minutes
Each group report back and compare their interpretations. Instructor facilitates discussion/provides feedback (20 minutes)
Instructor then demonstrates the webcam images/movies from the VEPP site for the same time periods/events as the data provided to the student groups so they can see whether they interpreted the data correctly or not. This is followed by discussion about uncertainties/ambiguities associated with real data and data interpretation. (10-15 minutes).

(Note: this resource was added to OER Commons as part of a batch upload of over 2,200 records. If you notice an issue with the quality of the metadata, please let us know by using the 'report' button and we will flag it for consideration.)
Subject:
Biology
Life Science
Physical Science
Physics
Material Type:
Activity/Lab
Provider:
Science Education Resource Center (SERC) at Carleton College
Provider Set:
Teach the Earth
Author:
PRAJUKTI Bhattacharyya
Date Added:
11/15/2016
VEPP: Volcano Monitoring and Interpretation of Real-Time Data: A Project for Non-Science Majors
Conditional Remix & Share Permitted
CC BY-NC-SA
Rating
0.0 stars

This is an exercise that is in development and has not yet been fully tested in the classroom. Please check back regularly for updates and changes.

An ongoing project for small class size comprised of non-science majors. Students use the VEPP website as a monitoring tool to document and interpret real-time volcanic deformation data at Pu'u 'O'o and determine whether an eruptive event is occurring. They also incorporate past events at Kilauea/Pu'u 'O'o as models.

Full length description:

This project should be started midway into the semester or quarter, continuing until the end of the semester (students must first have enough background in geology/volcanology before they can tackle this project successfully, so lectures on magmatic differentiation, types of volcanism- explosive vs effusive, and targeted activities need to precede the start of the project). Students need to know how to read the data on the VEPP website- if classroom wi-fi is available and most students have laptops, instruction on navigation and interpretation can take place in the classroom; if not, a computer lab may be required for at least one class session. However, a large part of familiarizing students with the website can also be accomplished lecture-style by the instructor logging on in a 'smart' classroom.

Students should be divided into three (or some suitable number of) groups: each group will be responsible for reporting weekly on a specific monitoring technique (tilt, seismic, GPS), retrieving and interpreting their information from VEPP/VALVE website. Additional information including updates, past information and geology may be obtained from the USGS Hawaiian Volcano Observatory website.

Students will report current deformation information each week in a "Monday morning meeting" format- each of the three groups will pass out a brief written summary on the data they are responsible for, and give an oral report with questions from the other two groups to follow each presentation. Team spokespersons will rotate every week. Each group will touch on potential sources of error associated with their particular monitoring technique, and attempt to differentiate between real information and what might be extraneous "noise". Groups should be given a short time to confer in class before they present, but prior outside group meetings will be essential to a successful weekly presentation.

At the end of the three group presentations, the instructor should moderate a general discussion by all in an attempt to have the groups integrate their data (i.e., does one data set support another? Is there disparity? What conclusions can be drawn from this particular week's information, and how does it seem to fit, both short-term and long-term?). Instructor may introduce other information sources, like live webcam photos and/or a discussion of past history, to offer support, or lack of support, for a specific interpretation of data being presented by a team or teams (HVO website is a great resource for this).

As the semester proceeds, each of the groups plot their data on a large graph situated in the front of the class. We'll use both graphical plots and location maps to pinpoint events if they occur. Lectures will incorporate other tools to hopefully enhance and lend credence to the interpretation process- use of geologic observations, gas emissions and other information, the main reference source being the HVO website. Past Kilauea/Pu'u 'O'o events will need to be examined for comparison purposes.

This exercise is meant to simulate some of the tasks that volcanologists undertake in the real world.

(Note: this resource was added to OER Commons as part of a batch upload of over 2,200 records. If you notice an issue with the quality of the metadata, please let us know by using the 'report' button and we will flag it for consideration.)
Subject:
Biology
Life Science
Physical Science
Physics
Material Type:
Activity/Lab
Provider:
Science Education Resource Center (SERC) at Carleton College
Provider Set:
Teach the Earth
Author:
Michael Johnson
Date Added:
11/15/2016
Virtual Oil Well
Conditional Remix & Share Permitted
CC BY-NC-SA
Rating
0.0 stars

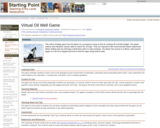
This strategy game has players prospect for oil using seismic profiles on limited budgets.

(Note: this resource was added to OER Commons as part of a batch upload of over 2,200 records. If you notice an issue with the quality of the metadata, please let us know by using the 'report' button and we will flag it for consideration.)
Subject:
Biology
Life Science
Physical Science
Physics
Material Type:
Activity/Lab
Provider:
Science Education Resource Center (SERC) at Carleton College
Provider Set:
Teach the Earth
Author:
Teaching Material by American Geological Institute - Starting Point page by R.E. Teed (SERC)
Date Added:
09/16/2022
Visualizing Earthquakes at Convergent Plate Margins
Conditional Remix & Share Permitted
CC BY-NC-SA
Rating
0.0 stars

This screenshot shows the Fiji subduction zone, one of the featured convergent margins in this visualization. The visualization shows how earthquakes at this margin occur at depth, and define the slope of the subducting plate. This visualization also includes other examples of subduction zones and continental convergent margins (Himalayas). Click the image to enlarge or view the MP4 movie (MP4 Video 30.3MB Dec20 11). The purpose of this activity is to introduce students to the distribution and characteristics of earthquakes associated with convergent plate boundaries. Students will learn about how the magnitude and distribution of earthquakes at convergent boundaries are related to processes that occur at these boundaries and to the geometry and position of the two converging plates. Because the depth of earthquakes can be difficult for students to visualize in 2D representations, this activity allows students to visualize the 3D distribution of earthquakes within Earth's surface, which is essential for understanding how different types of earthquakes occur in different tectonic settings. Locations featured in the visualization include the Chile-Peru Subduction Zone, the Aleutian Islands, the Fiji Subeuction Zone, and the Himalayas. Talking points and questions are included to use this visualization as part of an interactive lecture. In addition to playing back the visualization, instructors can also download the visualization software and data set and explore it themselves.

(Note: this resource was added to OER Commons as part of a batch upload of over 2,200 records. If you notice an issue with the quality of the metadata, please let us know by using the 'report' button and we will flag it for consideration.)
Subject:
Biology
Geology
Life Science
Physical Science
Material Type:
Activity/Lab
Provider:
Science Education Resource Center (SERC) at Carleton College
Provider Set:
Teach the Earth
Author:
Cara Harwood
Date Added:
09/30/2022
Visualizing Global Earthquakes â Where and Why do Earthquakes Occur?
Conditional Remix & Share Permitted
CC BY-NC-SA
Rating
0.0 stars

This screenshot from this visualization shows a map of tectonic plate boundaries. The visualization transitions between global earthquake distribution to a map of plate boundaries, to clearly illustrate how they are related. This visualization also includes an overview of the distribution and magnitude of earthquakes at different types of plate boundaries. Click the image to enlarge or view the MP4 movie ( PRIVATE FILE 31.1MB Jul27 11). The purpose of this activity is to introduce students to the distribution of earthquakes at and below the surface of earth and how their distribution is related to the geometry and type of plate boundaries. Because the depth of earthquakes can be difficult for students to visualize in 2D representations, this activity allows students to visualize the 3D distribution of earthquakes within Earth's surface, which is essential for understanding how different types of earthquakes occur in different tectonic settings. Talking points and questions are included to use this visualization as part of an interactive lecture. In addition to playing back the visualization, instructors can also download the visualization software and data set and explore it themselves.

(Note: this resource was added to OER Commons as part of a batch upload of over 2,200 records. If you notice an issue with the quality of the metadata, please let us know by using the 'report' button and we will flag it for consideration.)
Subject:
Biology
Life Science
Physical Science
Physics
Material Type:
Activity/Lab
Provider:
Science Education Resource Center (SERC) at Carleton College
Provider Set:
Teach the Earth
Author:
Cara Harwood
Date Added:
09/19/2022
Wave Propagation
Conditional Remix & Share Permitted
CC BY-NC-SA
Rating
0.0 stars

This course discusses theoretical concepts and analysis of wave problems in science and engineering. Examples are chosen from elasticity, acoustics, geophysics, hydrodynamics, blood flow, nondestructive evaluation, and other applications.

Subject:
Applied Science
Atmospheric Science
Engineering
Environmental Science
Oceanography
Physical Science
Physics
Material Type:
Full Course
Provider:
MIT
Provider Set:
MIT OpenCourseWare
Author:
Akylas, Triantaphyllos
Date Added:
02/01/2017
Waves Through Earth: Interactive Online Mac and PC
Conditional Remix & Share Permitted
CC BY-NC-SA
Rating
0.0 stars

Students vary the seismic P and S wave velocity through each of four concentric regions of Earth and match "data" for travel times vs. angular distance around Earth's surface from the source to detector.

(Note: this resource was added to OER Commons as part of a batch upload of over 2,200 records. If you notice an issue with the quality of the metadata, please let us know by using the 'report' button and we will flag it for consideration.)
Subject:
Biology
Geology
Life Science
Mathematics
Physical Science
Statistics and Probability
Material Type:
Activity/Lab
Provider:
Science Education Resource Center (SERC) at Carleton College
Provider Set:
Teach the Earth
Author:
JAVA Applet and activity provided by Visual Entities. Starting Point page organized by R.M. MacKay.
Date Added:
01/21/2022
Weighing and Determining the Average Density of Earth
Read the Fine Print
Rating
0.0 stars

Students learn how Newton's Law of Gravitation can be used to determine the mass of the Earth. By calculating mass and volume, they can then determine the Earth's density, and compare that result with the densities of other solar system bodies. Knowledge of Earth's density can also provide information about the planet's interior.

Subject:
Astronomy
Chemistry
Geology
Geoscience
Physical Science
Physics
Space Science
Material Type:
Activity/Lab
Interactive
Provider:
UCAR Staff
Provider Set:
New York State Earth Science Instructional Collection
Author:
Eryn Klosko
Date Added:
11/06/2014