Updating search results...

Search Resources

12 Results

View
Selected filters:
Climate change: How do we know?
Read the Fine Print
Rating
0.0 stars

This static graph of changes in CO2 concentrations goes back 400,000 years, showing the dramatic spike in recent years.

Subject:
Atmospheric Science
Physical Science
Provider:
CLEAN: Climate Literacy and Energy Awareness Network
Provider Set:
CLEAN: Climate Literacy and Energy Awareness Network
Author:
NASA
NASA Jet Propulsion Laboratory
Date Added:
10/27/2014
Fired Up Over Math: Studying Wildfires from Space
Read the Fine Print
Educational Use
Rating
0.0 stars

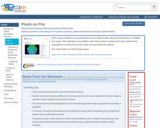
Students learn how scientists assess wildfires using remote sensing, then use some of the same techniques to solve grade-level appropriate math problems.

Subject:
Applied Science
Atmospheric Science
Career and Technical Education
Ecology
Environmental Science
Environmental Studies
Life Science
Physical Science
Material Type:
Activity/Lab
Provider:
CLEAN: Climate Literacy and Energy Awareness Network
Provider Set:
CLEAN: Climate Literacy and Energy Awareness Network
Author:
California Institute of Technology
Jet Propulsion Laboratory
National Aeronautical Space Administration
Date Added:
11/29/2020
Gas Problem
Read the Fine Print
Educational Use
Rating
0.0 stars

NASA produced white-board animation video explains key concepts about the role and source of carbon dioxide as a greenhouse gas.

Subject:
Applied Science
Atmospheric Science
Career and Technical Education
Environmental Science
Environmental Studies
Physical Science
Material Type:
Diagram/Illustration
Reading
Provider:
CLEAN: Climate Literacy and Energy Awareness Network
Provider Set:
CLEAN: Climate Literacy and Energy Awareness Network
Author:
Jet Propulsion Laboratory
National Aeronautics and Space Administration
Date Added:
06/25/2019
Graphing Sea-Level Trends
Read the Fine Print
Educational Use
Rating
0.0 stars

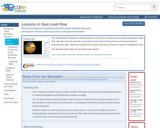
Students use long term sea-level rise data set to create models and compare short-term trends to long-term trends. They then determine whether sea-level rise is occurring based on the data.

Subject:
Applied Science
Career and Technical Education
Environmental Science
Environmental Studies
Oceanography
Physical Science
Material Type:
Activity/Lab
Provider:
CLEAN: Climate Literacy and Energy Awareness Network
Provider Set:
CLEAN: Climate Literacy and Energy Awareness Network
Author:
Jet Propulsion Laboratory
National Aeronautics and Space Administration
Date Added:
06/25/2019
Lessons in Sea-Level Rise
Read the Fine Print
Educational Use
Rating
0.0 stars

This activity allows students to examine graphs of sea level rise data as well as global temperature data. They calculate amounts and rates of sea level rise for various time periods and answer questions discussing the data. They then compare the sea level rise trends to those in a graph of temperature data.

Subject:
Applied Science
Career and Technical Education
Environmental Science
Environmental Studies
Oceanography
Physical Science
Material Type:
Activity/Lab
Provider:
CLEAN: Climate Literacy and Energy Awareness Network
Provider Set:
CLEAN: Climate Literacy and Energy Awareness Network
Author:
Jet Propulsion laboratory
National Aeronautics and Space Administration
Date Added:
06/25/2019
Meet the Greenhouse Gases
Read the Fine Print
Educational Use
Rating
0.0 stars

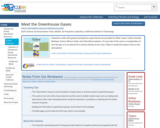
Interactive cards with gasses portrayed as super heroes are provided for Water Vapor, Carbon Dioxide, Methane, Ozone, Nitrous Oxide, and Chlorofluorocarbons. On one side of the card is an explanation of how the gas is in its natural form and by clicking on the card, it flips to reveal the impact it has on the atmosphere.

Subject:
Applied Science
Atmospheric Science
Career and Technical Education
Environmental Science
Environmental Studies
Physical Science
Material Type:
Reading
Provider:
CLEAN: Climate Literacy and Energy Awareness Network
Provider Set:
CLEAN: Climate Literacy and Energy Awareness Network
Author:
Earth Science Communications Team
NASA's Jet Propulsion Laboratory; California Institute of Technology
Date Added:
06/11/2020
NASA Global Warming Demonstration
Read the Fine Print
Educational Use
Rating
0.0 stars

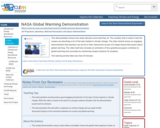
This demonstration shows how water absorbs more heat than air. The corollary that is made is that the oceans are absorbing a lot of the heat related to climate change. The video tutorial shows an engaging demonstration that teachers can do live in their classrooms as part of a larger lesson/discussion about global warming. The video itself also includes an animation of how greenhouse gases contribute to global warming and concludes by mentioning simple solutions for students.

Subject:
Applied Science
Career and Technical Education
Environmental Science
Environmental Studies
Oceanography
Physical Science
Material Type:
Activity/Lab
Interactive
Lesson
Provider:
CLEAN: Climate Literacy and Energy Awareness Network
Provider Set:
CLEAN: Climate Literacy and Energy Awareness Network
Author:
Jet Propulsion Laboratory
National Aeronautics and Space Administration
Date Added:
06/17/2019
Pixels on Fire
Read the Fine Print
Educational Use
Rating
0.0 stars

In this activity, students use measurement and area skills to learn about remote detection of wildfires from space. After detecting mock wildfires with mobile devices, students then study satellite-data visualizations to determine the start dates of actual California wildfires.

Subject:
Applied Science
Atmospheric Science
Career and Technical Education
Environmental Science
Environmental Studies
Physical Science
Material Type:
Activity/Lab
Provider:
CLEAN: Climate Literacy and Energy Awareness Network
Provider Set:
CLEAN: Climate Literacy and Energy Awareness Network
Author:
California Institute of Technology Jet Propulsion Laboratory
National Aeronautics and Space Administration
Date Added:
07/05/2021
Thermal Expansion Model
Read the Fine Print
Educational Use
Rating
0.0 stars

This activity allows students to demonstrate the thermal expansion of water for themselves using water bottles and straws. The discussion allows them to explore the connection between this concept and sea level rise due to climate change.

Subject:
Applied Science
Career and Technical Education
Environmental Science
Environmental Studies
Oceanography
Physical Science
Material Type:
Activity/Lab
Interactive
Lesson
Provider:
CLEAN: Climate Literacy and Energy Awareness Network
Provider Set:
CLEAN: Climate Literacy and Energy Awareness Network
Author:
Jet Propulsion Laboratory
National Aeronautics Space Administration
Date Added:
07/31/2019
Tracking Water Using NASA Satellite Data
Read the Fine Print
Educational Use
Rating
0.0 stars

Using real data from NASA's GRACE satellites, students will track water mass changes in the U.S., data that measures changes in ice, surface and especially groundwater. The background information includes an animated video about where water exists and how it moves around Earth, as well as short video clips to introduce the GRACE mission and explain how satellites collect data. Students will estimate water resources using heat-map data, create a line graph for a specific location, then assess trends and discuss implications.

This activity illustrates the importance of water resources and how changes in climate are closely linked to changes in water resources. The activity could fit into many parts of a science curriculum, for example a unit on water could be connected to climate change.

Subject:
Applied Science
Career and Technical Education
Environmental Science
Environmental Studies
Hydrology
Physical Science
Material Type:
Activity/Lab
Provider:
CLEAN: Climate Literacy and Energy Awareness Network
Provider Set:
CLEAN: Climate Literacy and Energy Awareness Network
Author:
Jet Propulsion Laboratory
National Aeronautics and Space Administration
Date Added:
06/25/2019
What's Causing Sea-Level Rise? Land Ice Vs. Sea Ice
Read the Fine Print
Educational Use
Rating
0.0 stars

This activity allows students to explore sea level rise. The experiment allows them to test whether land ice and/or sea ice contribute to sea level rise as they melt.

Subject:
Applied Science
Career and Technical Education
Environmental Science
Environmental Studies
Oceanography
Physical Science
Material Type:
Activity/Lab
Interactive
Lesson
Provider:
CLEAN: Climate Literacy and Energy Awareness Network
Provider Set:
CLEAN: Climate Literacy and Energy Awareness Network
Author:
Jet Propulsion Laboratory, California institute of Technology, National Aeronautics and Space Administration
Date Added:
06/21/2019
What's the Difference Between Weather and Climate?
Read the Fine Print
Educational Use
Rating
0.0 stars

This video, video transcript, and accompanying poster, go beyond a description of weather and climate to highlight how NASA tracks the changes in climate and why it matters. Students will leave the video with the important sense of why data (in this case, gathered by satellites) is helping all of us monitor sea level, clouds, and to know that the earth's climate is getting warmer.

Subject:
Career and Technical Education
Environmental Studies
Physical Science
Material Type:
Diagram/Illustration
Reading
Provider:
CLEAN: Climate Literacy and Energy Awareness Network
Provider Set:
CLEAN: Climate Literacy and Energy Awareness Network
Author:
Earth Science Communications Team
NASA's Jet Propulsion Laboratory; California Institute of Technology
Date Added:
06/11/2020