Unrestricted Use
Public Domain
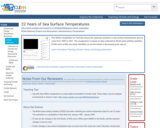
This NOAA visualization on YouTube shows the seasonal variations in sea surface temperatures and ice cover from 1985 to 2007. The visualization is based on data collected by NOAA polar-orbiting satellites. El NiÃo and La NiÃa are easily identified, as are the trends in decreasing polar sea ice.
- Subject:
- Applied Science
- Atmospheric Science
- Environmental Science
- Physical Science
- Material Type:
- Diagram/Illustration
- Provider:
- CLEAN: Climate Literacy and Energy Awareness Network
- Provider Set:
- CLEAN: Climate Literacy and Energy Awareness Network
- Author:
- NOAA (National Oceanic and Atmospheric Administration) Visualizations
- Date Added:
- 09/24/2018