Using cameras mounted to drones, students will design and construct an experiment …
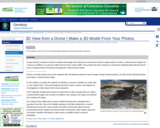
Using cameras mounted to drones, students will design and construct an experiment to take enough photos to make a 3-dimensional image of an outcrop or landform in a process called structure from motion (SfM). This activity has both a hands-on component (collecting data with the drone) and a computer-based component (creating the 3-dimensional model).___________________Drones can take photos that can be analyzed later. By planning ahead to have enough overlap between photos, you take those individual photos and make a 3-dimensional image!In this activity, you guide the students to identify an outcrop or landform to study later or over repeat visits. They go through the process to plan, conduct, and analyze an investigation to help answer their science question.The Challenge: Design and conduct an experiment to take enough photos to make a 3-dimensional image of an outcrop or landform, then analyze the image and interpret the resulting 3-d image.For instance they might wish to study a hillside that has been changed from a previous forest fire. How is the hillside starting to shift after rainstorms or snows? Monitoring an area over many months can lead to discoveries about how the erosional processes happen and also provide homeowners, park rangers, planners, and others valuable information to take action to stabilize areas to prevent landslides.
(Note: this resource was added to OER Commons as part of a batch upload of over 2,200 records. If you notice an issue with the quality of the metadata, please let us know by using the 'report' button and we will flag it for consideration.)
During this demo, participants use springs and a map of the Pacific …
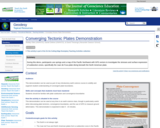
During this demo, participants use springs and a map of the Pacific Northwest with GPS vectors to investigate the stresses and surface expression of subduction zones, specifically the Juan de Fuca plate diving beneath the North American plate.
(Note: this resource was added to OER Commons as part of a batch upload of over 2,200 records. If you notice an issue with the quality of the metadata, please let us know by using the 'report' button and we will flag it for consideration.)
Research-grade Global Positioning Systems (GPS) allow students to deduce that Earth's crust …
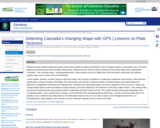
Research-grade Global Positioning Systems (GPS) allow students to deduce that Earth's crust is changing shape in measurable ways. From data gathered by EarthScope's Plate Boundary Observatory, students discover that the Pacific Northwest of the United States and coastal British Columbia -- the Cascadia region - are geologically active: tectonic plates move and collide; they shift and buckle; continental crust deforms; regions warp; rocks crumple, bend, and will break.
(Note: this resource was added to OER Commons as part of a batch upload of over 2,200 records. If you notice an issue with the quality of the metadata, please let us know by using the 'report' button and we will flag it for consideration.)
This hands-on demonstration illustrates how GPS instruments can be used in earthquake …
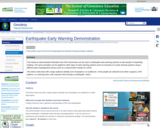
This hands-on demonstration illustrates how GPS instruments can be used in earthquake early warning systems to alert people of impending shaking. The same principles can be applied to other types of early warning systems (such as tsunami) or to early warning systems using a different type of geophysical sensor (such as a seismometer instead of a GPS).This demo is essentially a game that works best with a large audience (ideally over 30 people) in an auditorium. A few people are selected to be either surgeons, GPS stations, or a warning siren, with everyone else forming an earthquake "wave."
(Note: this resource was added to OER Commons as part of a batch upload of over 2,200 records. If you notice an issue with the quality of the metadata, please let us know by using the 'report' button and we will flag it for consideration.)
Earthquakes in western Washington and Oregon are to be expected -- the …
Earthquakes in western Washington and Oregon are to be expected -- the region lies in the Cascadia Subduction Zone. Offshore, the Juan de Fuca tectonic plate subducts under the North American plate, from northern California to British Columbia. The region, however, also experiences exotic seismicity -- Episodic Tremor and Slip (ETS).In this lesson, your students study seismic and GPS data from the region to recognize a pattern in which unusual tremors--with no surface earthquakes--coincide with jumps of GPS stations. This is ETS. Students model ductile and brittle behavior of the crust with lasagna noodles to understand how properties of materials depend on physical conditions. Finally, they assemble their knowledge of the data and models into an understanding of ETS in subduction zones and its relevance to the millions of residents in Cascadia.
(Note: this resource was added to OER Commons as part of a batch upload of over 2,200 records. If you notice an issue with the quality of the metadata, please let us know by using the 'report' button and we will flag it for consideration.)
Students conduct a regional seismic hazard analysis of a region of the …
Students conduct a regional seismic hazard analysis of a region of the United States of their choosing*. Using on-line data, they bring together and investigate the interaction of multiple types of data [ground motion (measured by GPS from UNAVCO), historical earthquake data and fault data] to associate rates of deformation and earthquake activity with hazard potential. Students would develop an assessment of seismic hazard potential. This project also introduces the idea of fault loading and qualitative earthquake interaction.
(Note: this resource was added to OER Commons as part of a batch upload of over 2,200 records. If you notice an issue with the quality of the metadata, please let us know by using the 'report' button and we will flag it for consideration.)
Using a map showing the horizontal velocities of GPS stations in the …
Using a map showing the horizontal velocities of GPS stations in the Plate Boundary Observatory and other GPS networks in Alaska and Western United States, students are able to describe the motions in different regions by interpreting the vectors resulting from long-term high-precision Global Positioning System (GPS) data. Show more information on NGSS alignment Hide NGSS ALIGNMENT Disciplinary Core Ideas History of Earth: HS-ESS1-5 Earth' Systems: MS-ESS2-2 Earth and Human Activity: MS-ESS3-2, HS-ESS3-1 Science and Engineering Practices 4. Analyzing and Interpreting Data 5. Using Mathematics and Computational Thinking 6. Constructing Explanations and Designing Solutions Crosscutting Concepts 4. Systems and System Models 7. Stability and Change
(Note: this resource was added to OER Commons as part of a batch upload of over 2,200 records. If you notice an issue with the quality of the metadata, please let us know by using the 'report' button and we will flag it for consideration.)
With printouts of typical GPS velocity vectors found near different tectonic boundaries …
With printouts of typical GPS velocity vectors found near different tectonic boundaries and models of a GPS station, demonstrate how GPS work to measure ground motion.GPS velocity vectors point in the direction that a GPS station moves as the ground it is anchored to moves. The length of a velocity vector corresponds to the rate of motion. GPS velocity vectors thus provide useful information for how Earth's crust deforms in different tectonic settings.
(Note: this resource was added to OER Commons as part of a batch upload of over 2,200 records. If you notice an issue with the quality of the metadata, please let us know by using the 'report' button and we will flag it for consideration.)
This lesson teaches middle and high school students to understand the architecture …
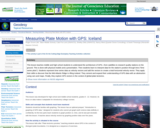
This lesson teaches middle and high school students to understand the architecture of GPS -- from satellites to research quality stations on the ground. This is done with physical models and a presentation. Then students learn to interpret data for the station's position through time ("time series plots"). Students represent time series data as velocity vectors and add the vectors to create a total horizontal velocity vector. They apply their skills to discover that the Mid-Atlantic Ridge is rifting Iceland. They cement and expand their understanding of GPS data with an abstraction using cars and maps. Finally, they explore GPS vectors in the context of global plate tectonics.
(Note: this resource was added to OER Commons as part of a batch upload of over 2,200 records. If you notice an issue with the quality of the metadata, please let us know by using the 'report' button and we will flag it for consideration.)
Using string, bubble gum, and a model of a GPS station, demonstrate …
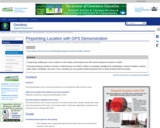
Using string, bubble gum, and a model of a GPS station, demonstrate how GPS work to pinpoint a location on Earth.Precisely knowing a location on Earth is useful because our Earth's surface is constantly changing from earthquakes, volcanic eruptions, tectonic plate motion, landslides, and more. Thus, scientists can use positions determined with GPS to study all these Earth processes.
(Note: this resource was added to OER Commons as part of a batch upload of over 2,200 records. If you notice an issue with the quality of the metadata, please let us know by using the 'report' button and we will flag it for consideration.)
This activity provides a brief introduction to GPS and provides a student …
This activity provides a brief introduction to GPS and provides a student activity to practice creating and reading time series plots with simplified GPS data. Students graph how a tectonic plate (and the GPS unit attached to it) has moved over a five year time period by moving a GPS model across a North-East coordinate graph. Students practice these skills by analyzing GPS time series from two GPS stations in Iceland. Teaching Tips Adaptations that allow this activity to be successful in an online environment Need to really transform to an online environment. I did have one participant draw the vectors on an online map of Iceland - however, only one person gets to do this, so I'd like to figure out other techniques for this.
Elements of this activity that are most effective
Recommendations for other faculty adapting this activity to their own course:
(Note: this resource was added to OER Commons as part of a batch upload of over 2,200 records. If you notice an issue with the quality of the metadata, please let us know by using the 'report' button and we will flag it for consideration.)
Using two sets of flubber, one representing the Earth and one representing …
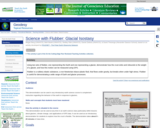
Using two sets of flubber, one representing the Earth and one representing a glacier, demonstrate how the crust sinks and rebounds to the weight of a glacier, and how this motion can be measured using GPS.Flubber is a rubbery elastic substance, a non-Newtonian elasco-plastic fluid, that flows under gravity, but breaks when under high stress. Flubber is useful for demonstrating a wide range of Earth and glacier processes.
(Note: this resource was added to OER Commons as part of a batch upload of over 2,200 records. If you notice an issue with the quality of the metadata, please let us know by using the 'report' button and we will flag it for consideration.)
Learners use the UNAVCO GPS Velocity Viewer, or the included map packet …
Learners use the UNAVCO GPS Velocity Viewer, or the included map packet to visualize relationships between earthquakes, volcanoes, and plate boundaries as a jigsaw activity.
(Note: this resource was added to OER Commons as part of a batch upload of over 2,200 records. If you notice an issue with the quality of the metadata, please let us know by using the 'report' button and we will flag it for consideration.)
No restrictions on your remixing, redistributing, or making derivative works. Give credit to the author, as required.
Your remixing, redistributing, or making derivatives works comes with some restrictions, including how it is shared.
Your redistributing comes with some restrictions. Do not remix or make derivative works.
Most restrictive license type. Prohibits most uses, sharing, and any changes.
Copyrighted materials, available under Fair Use and the TEACH Act for US-based educators, or other custom arrangements. Go to the resource provider to see their individual restrictions.