Using the 5E instructional model, students discover the value of using color …
Using the 5E instructional model, students discover the value of using color maps to visualize data. The activity requires students to create a color map of the ozone hole from Dobson data values derived from the Aura satellite. Students then interpret that map and compare and evaluate different color scales. Note that this is the Spanish version of Exploring Color Maps: Using Stratospheric Ozone Data.
Through the use of the 5E instructional model, students discover the value …
Through the use of the 5E instructional model, students discover the value of using color maps to visualize data. The activity requires students to create a color map of the ozone hole from Dobson data values derived from the Aura satellite. Students then interpret that map and compare and evaluate different color scales.
This resource contains directions for a project about Indigenous mapmaking. Informed by …
This resource contains directions for a project about Indigenous mapmaking. Informed by readings on Indigenous mapmaking, students are asked to re-create a map incorporating Indigenous map-making practices and methods and to write a reflection essay.
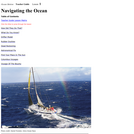
Navigational tools and methods of early voyagers provide the background and contrast …
Navigational tools and methods of early voyagers provide the background and contrast to the satellite images and models used today. Students complete mapping activities based on historical data from Columbus and Blith. Students will also use a computer model of ocean currents to investigate the movement of objects drifting on the ocean surface. Note that this is lesson one of five on the Ocean Motion website. Each lesson investigates ocean surface circulation using satellite and model data and can be done independently. See Related URL's for links to the Ocean Motion Website which provide science background information, data resources, teacher material, student guides and a lesson matrix.
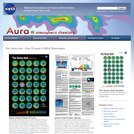
This two-sided poster presents images and information about ozone. The front features …
This two-sided poster presents images and information about ozone. The front features a series of color Earth images; each image reflects total ozone readings taken every October from 1979 to 2012. The poster back contains information about ozone under the following headings: What is Ozone?, Chemistry of the Ozone Layer, Measuring Ozone in the Earth's Atmosphere, Timeline of Stratospheric Ozone Depletion and Observations, How the Ozone Hole Forms, and A World Avoided. In addition, the back contains two activities: Visualizing the Ozone Hole and a Color by Number worksheet.
This is a lesson about the vertical dimension of the atmosphere and …
This is a lesson about the vertical dimension of the atmosphere and includes four activities. Activity 1 Introduces concepts related to distance, including length and height and units of measurement. Students are asked to make comparisons of distances. In activity 2, students learn about the vertical profile of the atmosphere. They work with a graph and plot the heights of objects and the layers of the atmosphere: troposphere, stratosphere, mesosphere, thermosphere, and exosphere. In activity 3, students learn about other forms of visual displays using satellite imagery. They compare images of the same weather feature, a hurricane, using two different images from MODIS and CALIPSO. One image is looking down on the hurricane from space, the other looks through the hurricane to display a profile of the hurricane. Activity 4 reinforces the concept of the vertical nature of the atmosphere. Students will take a CALIPSO satellite image that shows a profile of the atmosphere and use this information to plot mountains and clouds on their own graph of the atmosphere. The recommended order for the activities is to complete the first two activities on day one, and the second two activities on day two. Each day will require approximately 1 to 1.5 hours.
No restrictions on your remixing, redistributing, or making derivative works. Give credit to the author, as required.
Your remixing, redistributing, or making derivatives works comes with some restrictions, including how it is shared.
Your redistributing comes with some restrictions. Do not remix or make derivative works.
Most restrictive license type. Prohibits most uses, sharing, and any changes.
Copyrighted materials, available under Fair Use and the TEACH Act for US-based educators, or other custom arrangements. Go to the resource provider to see their individual restrictions.