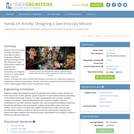
Students are introduced to measuring and identifying sources of air pollution, as …
Students are introduced to measuring and identifying sources of air pollution, as well as how environmental engineers try to control and limit the amount of air pollution. In Part 1, students are introduced to nitrogen dioxide as an air pollutant and how it is quantified. Major sources are identified, using EPA bar graphs. Students identify major cities and determine their latitudes and longitudes. They estimate NO2 values from color maps showing monthly NO2 averages from two sources: a NASA satellite and the WSU forecast model AIRPACT. In Part 2, students continue to estimate NO2 values from color maps and use Excel to calculate differences and ratios to determine the model's performance. They gain experience working with very large numbers written in scientific notation, as well as spreadsheet application capabilities.
This is an introduction to the physics of atmospheric radiation and remote …
This is an introduction to the physics of atmospheric radiation and remote sensing including use of computer codes. Subjects covered include: radiative transfer equation including emission and scattering, spectroscopy, Mie theory, and numerical solutions. We examine the solution of inverse problems in remote sensing of atmospheric temperature and composition.
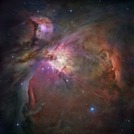
When we look at the night sky, we see stars and the …
When we look at the night sky, we see stars and the nearby planets of our own solar system. Many of those stars are actually distant galaxies and glowing clouds of dust and gases called nebulae. The universe is an immense space with distances measured in light years. The more we learn about the universe beyond our solar system, the more we realize we do not know. Students are introduced to the basic known facts about the universe, and how engineers help us explore the many mysteries of space.
Students create and decorate their own spectrographs using simple materials and holographic …
Students create and decorate their own spectrographs using simple materials and holographic diffraction gratings. A holographic diffraction grating acts like a prism, showing the visual components of light. After building the spectrographs, students observe the spectra of different light sources as homework.
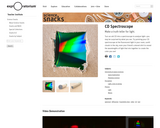
Turn an old CD into a spectroscope to analyze light—you may be …
Turn an old CD into a spectroscope to analyze light—you may be surprised by what you see. Try pointing your CD spectroscope at the fluorescent light in your room, sunlit clouds in the sky, even your friend’s colored shirt to reveal the wavelengths of light that mix together to create the color you see!
This course is an intensive introduction to the techniques of experimental chemistry …
This course is an intensive introduction to the techniques of experimental chemistry and gives first year students an opportunity to learn and master the basic chemistry lab techniques for carrying out experiments. Students who successfully complete the course and obtain a “Competent Chemist” (CC) or “Expert Experimentalist” (EE) rating are likely to secure opportunities for research work in a chemistry lab at MIT. Acknowledgements The laboratory manual and materials for this course were prepared by Dr. Katherine J. Franz and Dr. Kevin M. Shea with the assistance of Professors Rick L. Danheiser and Timothy M. Swager. Materials have been revised by Dr. J. Haseltine, Dr. Kevin M. Shea, Dr. Sarah A. Tabacco, Dr. Kimberly L. Berkowski, Anne M. (Gorham) Rachupka, and Dr. John J. Dolhun. WARNING NOTICE The experiments described in these materials are potentially hazardous and require a high level of safety training, special facilities and equipment, and supervision by appropriate individuals. You bear the sole responsibility, liability, and risk for the implementation of such safety procedures and measures. MIT shall have no responsibility, liability, or risk for the content or implementation of any of the material presented. Legal Notice
This demonstration shows that similar-appearing lights can be distinctly different, suggesting that …
This demonstration shows that similar-appearing lights can be distinctly different, suggesting that the light emitted is generated in different ways. It requires some advance preparation/setup by the teacher and three recommended sources of orange light, that can be purchased at a hardware or department store. Includes extensions and additional background information on light generation in a section on underlying principles. This resource is from PUMAS - Practical Uses of Math and Science - a collection of brief examples created by scientists and engineers showing how math and science topics taught in K-12 classes have real world applications.
Students find and calculate the angle that light is transmitted through a …
Students find and calculate the angle that light is transmitted through a holographic diffraction grating using trigonometry. After finding this angle, student teams design and build their own spectrographs, researching and designing a ground- or space-based mission using their creation. At project end, teams present their findings to the class, as if they were making an engineering conference presentation. Student must have completed the associated Building a Fancy Spectrograph activity before attempting this activity.
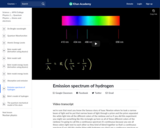
Using Balmer-Rydberg equation to solve for photon energy for n=3 to 2 …
Using Balmer-Rydberg equation to solve for photon energy for n=3 to 2 transition. Solving for wavelength of a line in UV region of hydrogen emission spectrum. Created by Jay.
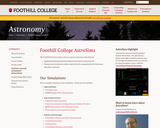
The Foothill College AstroSims project is ensuring continued access to astro-education simulations …
The Foothill College AstroSims project is ensuring continued access to astro-education simulations past the deprecation of Java and Flash. This site includes:
* re-implementations in HTML5/Javascript of existing astro-education simulations, * new simulations of previously unaddressed topics, and * a frequently updated list of astro-education simulations.
This is a continuation of Freshman Organic Chemistry I (CHEM 125a), the …
This is a continuation of Freshman Organic Chemistry I (CHEM 125a), the introductory course on current theories of structure and mechanism in organic chemistry for students with excellent preparation in chemistry and physics. This semester treats simple and complex reaction mechanisms, spectroscopy, organic synthesis, and some molecules of nature.
This class introduces the student to the use of small telescopes, either …
This class introduces the student to the use of small telescopes, either for formal research or as a hobby. This course covers background for and techniques of visual observation, electronic imaging, and spectroscopy of the Moon, planets, satellites, stars, and brighter deep-space objects. Weekly outdoor observing sessions using 8-inch diameter telescopes when weather permits. Indoor sessions introduce needed skills. Introduction to contemporary observational astronomy including astronomical computing, image and data processing, and how astronomers work. Student must maintain a careful and complete written log which is graded. (Limited enrollment with priority to freshmen. Consumes an entire evening each week; 100% attendance at observing sessions required to pass.)
This course is the first part of a modular sequence of increasingly …
This course is the first part of a modular sequence of increasingly sophisticated (and challenging) laboratory courses required of all Chemistry majors: 5.35 Introduction to Experimental Chemistry, 5.36 Biochemistry and Organic Laboratory, 5.37 Organic and Inorganic Laboratory, and 5.38 Physical Chemistry Laboratory. This course provides students with a survey of spectroscopy, and introduces synthesis of coordination compounds and kinetics. This class is part of the new laboratory curriculum in the MIT Department of Chemistry. Undergraduate Research-Inspired Experimental Chemistry Alternatives (URIECA) introduces students to cutting edge research topics in a modular format. Acknowledgements Professor Nelson and Dr. Twardowski would like to acknowledge the contributions of MIT Professor Timothy Swager to the development of this course. Module 3 on Fabrication of a Polymeric Light Emitting Device, taught by Timothy Swager, is not currently available on OCW.
This text includes 25 reading assignments for an introductory astronomy course. They …
This text includes 25 reading assignments for an introductory astronomy course. They have been modified from the OpenStax Astronomy 2e and College Physics 2e (linked in related resources below) textbooks to order the topics in a logical manner for a one semester course and provide shortened (~10-20 pages) readings intended for biweekly reading assignments. The text also features enhanced treatment of the Newton's Laws, Energy, and Optics content that go beyond the typical introductory astronomy course for non-majors.
Course connections: This content was built for an introductory survey of astronomy course (e.g., PHYS 103), including apparent motions of objects in the sky, light, telescopes, solar system objects, exoplanets, the sun, stars, galaxies, and cosmology. Basic math skills (arithmetic, powers, scientific notation, unit conversions) will be used frequently. This course is designed for students in all majors.
This course covers topics in time-dependent quantum mechanics, spectroscopy, and relaxation, with …
This course covers topics in time-dependent quantum mechanics, spectroscopy, and relaxation, with an emphasis on descriptions applicable to condensed phase problems and a statistical description of ensembles.
This course covers time-dependent quantum mechanics and spectroscopy. Topics include perturbation theory, …
This course covers time-dependent quantum mechanics and spectroscopy. Topics include perturbation theory, two-level systems, light-matter interactions, relaxation in quantum systems, correlation functions and linear response theory, and nonlinear spectroscopy.
In order to understand how we study the universe, we need to …
In order to understand how we study the universe, we need to talk a little bit about light. Light is a form of energy. Its wavelength tells us its energy and color. Spectroscopy allows us to analyze those colors and determine an object’s temperature, density, spin, motion, and chemical composition.
Chapters: Introduction Light is a Wave Electromagnetic Spectrum How is Light Made? Atomic Structure Spectroscopy Redshift vs Blueshift Review
Dieter Hartmann, a high-energy physicist, presents a story-based lesson on the science …
Dieter Hartmann, a high-energy physicist, presents a story-based lesson on the science of Gamma-Ray astronomy. The lesson focuses on gamma-ray bursts; examining their sources, types, and links to the origin and evolution of the Universe. The story-based format of the lesson also provides insights into the nature of science. Students answer questions based on the reading guide. A list of supplemental websites is also included.
This intermediate organic chemistry course focuses on the methods used to identify …
This intermediate organic chemistry course focuses on the methods used to identify the structure of organic molecules, advanced principles of organic stereochemistry, organic reaction mechanisms, and methods used for the synthesis of organic compounds. Additional special topics include illustrating the role of organic chemistry in biology, medicine, and industry.
No restrictions on your remixing, redistributing, or making derivative works. Give credit to the author, as required.
Your remixing, redistributing, or making derivatives works comes with some restrictions, including how it is shared.
Your redistributing comes with some restrictions. Do not remix or make derivative works.
Most restrictive license type. Prohibits most uses, sharing, and any changes.
Copyrighted materials, available under Fair Use and the TEACH Act for US-based educators, or other custom arrangements. Go to the resource provider to see their individual restrictions.