This site describes how and when 100-year floods occur. It states that …
This site describes how and when 100-year floods occur. It states that flood designations are based on statistical averages, not on the number of years between big floods. It also suggests that it would make more sense to refer to 100-year floods as 1-in-100 chance floods. This resource is a United States Geological Survey (USGS) Fact Sheet. It can be used in teaching quantitative skills.
This is a computer-based activity in which students retrieve data from websites …
This is a computer-based activity in which students retrieve data from websites maintained by the US Geological Survey (USGS) and the National Weather Service (NWS), and then use that data to test different hypotheses regarding streamflow and precipitation. Students import data from web sites into a spreadsheet program where they can construct scatter plots and perform simple statistical tests. The activity has two components, the first focusing on relations between streamflow and drainage basin characteristics (drainage area, slope, precipitation), the second focusing on trends in annual precipitation at two locations in the USA: Burlington, VT, and Boulder, CO. As part of the second component, students conduct a statistical test to determine if the long-term trends in precipitation are significant.
(Note: this resource was added to OER Commons as part of a batch upload of over 2,200 records. If you notice an issue with the quality of the metadata, please let us know by using the 'report' button and we will flag it for consideration.)
Students learn about the differences between types of water (surface and ground), …
Students learn about the differences between types of water (surface and ground), as well as the differences between streams, rivers and lakes. Then, they learn about dissolved organic matter (DOM), and the role it plays in identifying drinking water sources. Finally, students are introduced to conventional drinking water treatment processes.
This course covers examination of the state of knowledge of planetary formation, …
This course covers examination of the state of knowledge of planetary formation, beginning with planetary nebulas and continuing through accretion (from gas, to dust, to planetesimals, to planetary embryos, to planets). It also includes processes of planetary differentiation, crust formation, atmospheric degassing, and surface water condensation. This course has integrated discussions of compositional and physical processes, based upon observations from our solar system and from exoplanets. Focus on terrestrial (rocky and metallic) planets, though more volatile-rich bodies are also examined.
This is a field based exercise that exposes students to streams as …
This is a field based exercise that exposes students to streams as a major agent of erosion and to methods of quantifying stream discharge by collecting data in the field. Students also apply basic navigation skills by using hand-held GPS devices and plotting longitude and latitude of the field sites under investigation.
(Note: this resource was added to OER Commons as part of a batch upload of over 2,200 records. If you notice an issue with the quality of the metadata, please let us know by using the 'report' button and we will flag it for consideration.)
In this activity the students calculate recurrence intervals for some historical crests …
In this activity the students calculate recurrence intervals for some historical crests on the Chippewa River and identify the 100-year flood plain in downtown Eau Claire. The students also evaluate the effect of a 20ft high stage event along the whole Chippewa River with the goal of showing how topography influences the size of the area affected by flooding events. The students also evaluate the effectiveness of a flood gate system located on campus.
(Note: this resource was added to OER Commons as part of a batch upload of over 2,200 records. If you notice an issue with the quality of the metadata, please let us know by using the 'report' button and we will flag it for consideration.)
This activity is a two-part (three week) lab in which students initially …
This activity is a two-part (three week) lab in which students initially develop a claim (non-scientific) and learn how to use evidence to support a claim. They then are provided with a scientific research question for which they need to make a claim supported with evidence from their own models (river/stream tables). Based on their results, they then ask a new research question, design the model, carry out their tests and report their results.
(Note: this resource was added to OER Commons as part of a batch upload of over 2,200 records. If you notice an issue with the quality of the metadata, please let us know by using the 'report' button and we will flag it for consideration.)
In this quantitative field activity, students collect field data on channel geometry, …
In this quantitative field activity, students collect field data on channel geometry, flow velocity, and bed materials. Using these data, they apply flow resistance equations and sediment transport relations to estimate the bankfull discharge and to determine if the flow is sufficient to mobilize the bed.
(Note: this resource was added to OER Commons as part of a batch upload of over 2,200 records. If you notice an issue with the quality of the metadata, please let us know by using the 'report' button and we will flag it for consideration.)
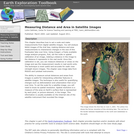
DATA: MODIS Imagery. TOOL: ImageJ. SUMMARY: Examine images of the Aral Sea …
DATA: MODIS Imagery. TOOL: ImageJ. SUMMARY: Examine images of the Aral Sea from 1973 through 2003. Use image analysis software to measure changes in the width and area of the freshwater lake over time.
(Note: this resource was added to OER Commons as part of a batch upload of over 2,200 records. If you notice an issue with the quality of the metadata, please let us know by using the 'report' button and we will flag it for consideration.)
Rapid changes at Earth's surface, largely in response to human activity, have …
Rapid changes at Earth's surface, largely in response to human activity, have led to the realization that fundamental questions remain to be answered regarding the natural functioning of the Critical Zone, the thin veneer at Earth's surface where the atmosphere, lithosphere, hydrosphere and biosphere interact. EARTH 530 will introduce you to the basics necessary for understanding Earth surface processes in the Critical Zone through an integration of various scientific disciplines. Those who successfully complete EARTH 530 will be able to apply their knowledge of fundamental concepts of Earth surface processes to understanding outstanding fundamental questions in Critical Zone science and how their lives are intimately linked to Critical Zone health.
The learning objectives for this GIS exercise are to 1) understand rainfall …
The learning objectives for this GIS exercise are to 1) understand rainfall spatial variability and how to account for it when making areal-rainfall estimates, and 2) learn how ArcGIS can be used as a tool to determine areal averages, and 3) compare the advantages and drawbacks of the various techniques.
(Note: this resource was added to OER Commons as part of a batch upload of over 2,200 records. If you notice an issue with the quality of the metadata, please let us know by using the 'report' button and we will flag it for consideration.)
This module introduces students to the fundamental principles and uses of electrical …
This module introduces students to the fundamental principles and uses of electrical resistivity, with a focus on an environmental application. Students explore the characteristics and environmental setting of Harrier Meadow, a saltmarsh just outside of New York City. They investigate the relationship between electrical resistivity and physical properties of the soil in the marsh. Students also discover how variations in survey configuration parameters control investigation depth (how far into the ground the signals sense) and spatial resolution (what size objects can be detected). Finally, students learn about and then perform geophysical inversion, which is the process of estimating the geophysical properties of the subsurface from geophysical observations. In the final unit of the module, students evaluate the extent to which the geophysical dataset and direct physical measurements support the hypothesis, introduced in Unit 1, accounting for the distribution of Pickleweed in Harrier Meadow. This module is intended to require approximately 2-3 weeks of class time. Teaching material includes PowerPoints that may be used in lectures or provided for self-guided learning, exercises, and handouts that ask students to synthesize what they learn from the exercises. In addition, multiple choice and short answer questions can be given to students as homework, on quizzes, or on exams.
(Note: this resource was added to OER Commons as part of a batch upload of over 2,200 records. If you notice an issue with the quality of the metadata, please let us know by using the 'report' button and we will flag it for consideration.)
This Lecture Tutorial worksheet guides students through thinking about the effects humans …
This Lecture Tutorial worksheet guides students through thinking about the effects humans have on infiltration, and how that effects the duration and severity of floods. It is designed to be used in groups after a brief lecture introducing surface and ground water flow into a stream.
(Note: this resource was added to OER Commons as part of a batch upload of over 2,200 records. If you notice an issue with the quality of the metadata, please let us know by using the 'report' button and we will flag it for consideration.)
SSAC Geology of National Parks module/Geology of National Parks course. Students calculate …
SSAC Geology of National Parks module/Geology of National Parks course. Students calculate probabilities using USGS hydrograph data, a spreadsheet of daily stage heights, and the COUNTIF function.
SSAC Geology of National Parks module/Geology of National Parks course. Students calculate …
SSAC Geology of National Parks module/Geology of National Parks course. Students calculate probabilities using USGS hydrograph data, a spreadsheet of daily stage heights, and the COUNTIF function.
(Note: this resource was added to OER Commons as part of a batch upload of over 2,200 records. If you notice an issue with the quality of the metadata, please let us know by using the 'report' button and we will flag it for consideration.)
Mark C. Rains (University of South Florida), David C. Shelley (National Parks Service) and Len Vacher (University of South Florida)
Cover page by Len Vacher, University of South Florida
In this lab, students measure a topographic and geologic cross-section across a …
In this lab, students measure a topographic and geologic cross-section across a floodplain by simple surveying and auguring techniques.
(Note: this resource was added to OER Commons as part of a batch upload of over 2,200 records. If you notice an issue with the quality of the metadata, please let us know by using the 'report' button and we will flag it for consideration.)
Students explore the USGS water website to identify the location of stream …
Students explore the USGS water website to identify the location of stream gauges on the Minnesota River and the types of data that can be retrieved from the website. They determine which data to download based on the area of interest in the exercise (St. Peter, MN) and import historical flood data into MS Excel. The students use a spreadsheet to rank each flood and calculate a recurrence interval for a given flood, then estimate the discharge and stage of the 100-year flood in St. Peter, MN. The final task is to establish a flood hazard zone on a topographic map of the city of St. Peter. Note: this exercise can be applied to almost any non-dammed river with two or more USGS gaging stations on it. Go to http://water.usgs.gov and select your state from the pull-down menu to view an interactive map of your state's rivers and gaging station locations.
(Note: this resource was added to OER Commons as part of a batch upload of over 2,200 records. If you notice an issue with the quality of the metadata, please let us know by using the 'report' button and we will flag it for consideration.)
This exercise looks at the dollar losses and deaths caused by flooding …
This exercise looks at the dollar losses and deaths caused by flooding in the US, and at the causes of, and relationships between the two trends.
(Note: this resource was added to OER Commons as part of a batch upload of over 2,200 records. If you notice an issue with the quality of the metadata, please let us know by using the 'report' button and we will flag it for consideration.)
This is the data collection portion of a semester-long project. Before this …
This is the data collection portion of a semester-long project. Before this lab, students will have graphed discharge data for one previous water year, graphed similar data collected by classes during a previous year, written one-page explanations of the techniques that they will be using, and speculated about the results they expect to get. After this lab, their data will be shared with other lab sections, which will have collected similar data at other sites along the same river. Each research group will present their preliminary data to the class during a later lab meeting, and the class will discuss how the different types of data relate to one another. The project culminates in a final paper (one per research group).
(Note: this resource was added to OER Commons as part of a batch upload of over 2,200 records. If you notice an issue with the quality of the metadata, please let us know by using the 'report' button and we will flag it for consideration.)
This is a homework assignment used as preparation for a group research …
This is a homework assignment used as preparation for a group research project. Students graph annual discharge data from a local river by hand, and compare the discharge patterns from the stream above a reservoir with those below the dam. This exercise gives students practice graphing a small amount of data by hand, and gets them thinking about ways graphs can be used to help interpret data.
(Note: this resource was added to OER Commons as part of a batch upload of over 2,200 records. If you notice an issue with the quality of the metadata, please let us know by using the 'report' button and we will flag it for consideration.)
No restrictions on your remixing, redistributing, or making derivative works. Give credit to the author, as required.
Your remixing, redistributing, or making derivatives works comes with some restrictions, including how it is shared.
Your redistributing comes with some restrictions. Do not remix or make derivative works.
Most restrictive license type. Prohibits most uses, sharing, and any changes.
Copyrighted materials, available under Fair Use and the TEACH Act for US-based educators, or other custom arrangements. Go to the resource provider to see their individual restrictions.