Unrestricted Use
CC BY
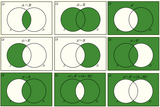
A Venn diagram is a visual representation of similarities and differences between two or more concepts. It depicts relationships between two or more sets of data by using circles as an illustration. Each circle represents one particular set of data. Overlapping circles represent the similarities, while detached circles represent the difference between sets or concepts.
- Subject:
- Computer Science
- Management
- Mathematics
- Statistics and Probability
- Material Type:
- Lecture Notes
- Author:
- Lucy Ngugi
- Date Added:
- 02/15/2022