- Subject:
- Mathematics
- Material Type:
- Lesson Plan
- Level:
- Middle School
- Grade:
- 7
- Provider:
- Pearson
- Tags:
- License:
- Creative Commons Attribution Non-Commercial
- Language:
- English
- Media Formats:
- Text/HTML
Running
Gallery Problems Exercise
Overview
Allow students who have a clear understanding of the content thus far in the unit to work on Gallery problems of their choosing. You can then use this time to provide additional help to students who need review of the unit's concepts or to assist students who may have fallen behind on work.
Gallery Description
Running
Runners use the term pace. Students will explore what this term means.
Best Buy
Students compare the prices at a market.
Running a Car Wash
Students determine what it takes to run a car wash.
Stacking Tires
Students figure out how to stack tires in a certain garage.
Postal Rates
Students determine whether the post office uses a proportional relationship for the cost of postage.
Recycling
Students figure out the mathematics in recycling.
Tiling Models
Students find a way of describing two patterns mathematically.
Two Walkers
Students compare the rates of two walkers participating in a walk-a-thon.
Running
Answers
- is how long it takes to run 1 mile. This is why talking about a runner's pace is the same as talking about how fast the runner is going.
- Run 48 has the lowest , so it is the fastest pace (because a smaller value for pace means it takes less time to run 1 mile).
- Graphs should have time on the x-axis and distance on the y-axis.
• John was running faster than his intended pace for the first 5 miles, but then ran slower than his intended pace for the last 3 miles. He ended up finishing his 8-mile run 1 minute slower than he intended to. 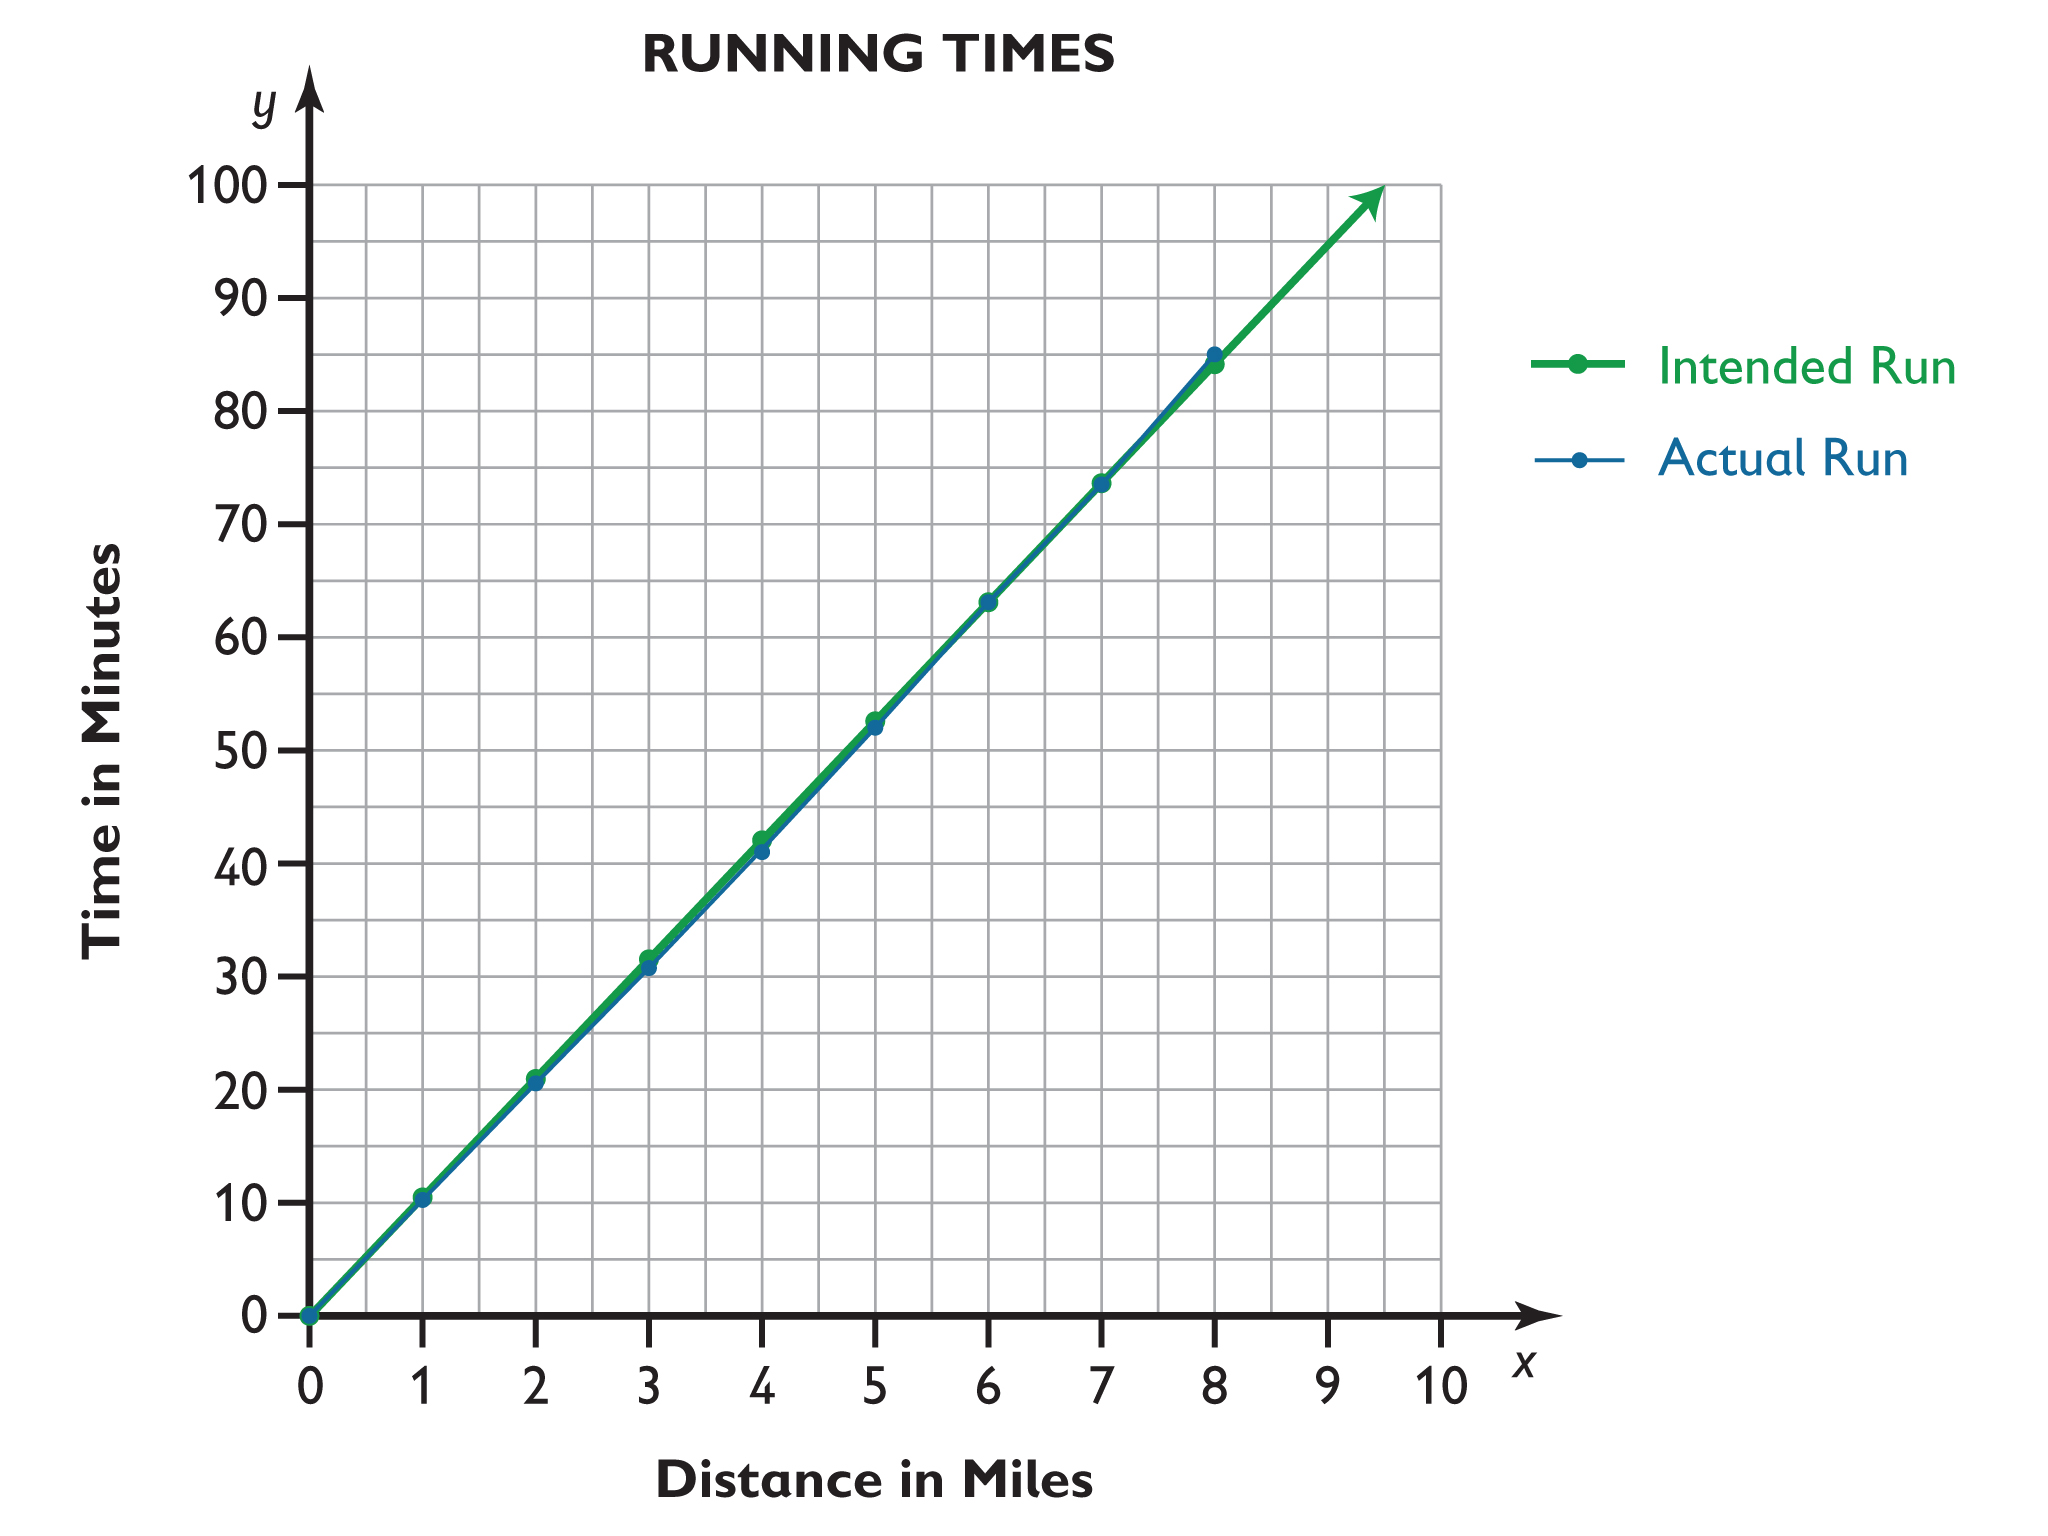
• Approximately 5.65
Work Time
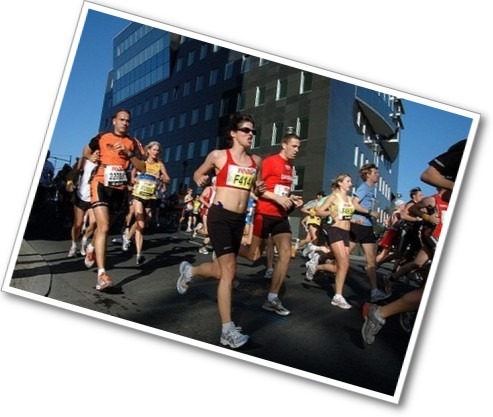
Running
Runners are always keeping track of their running times, whether it is during training or in competition. They sometimes use apps, such as the running log shown here, to do most of the data collection.
- The running log shows an interesting rate: minutes/mile or "pace." Explain what this is.
The running log shows data for 10 runs. Which run was the fastest in terms of speed?
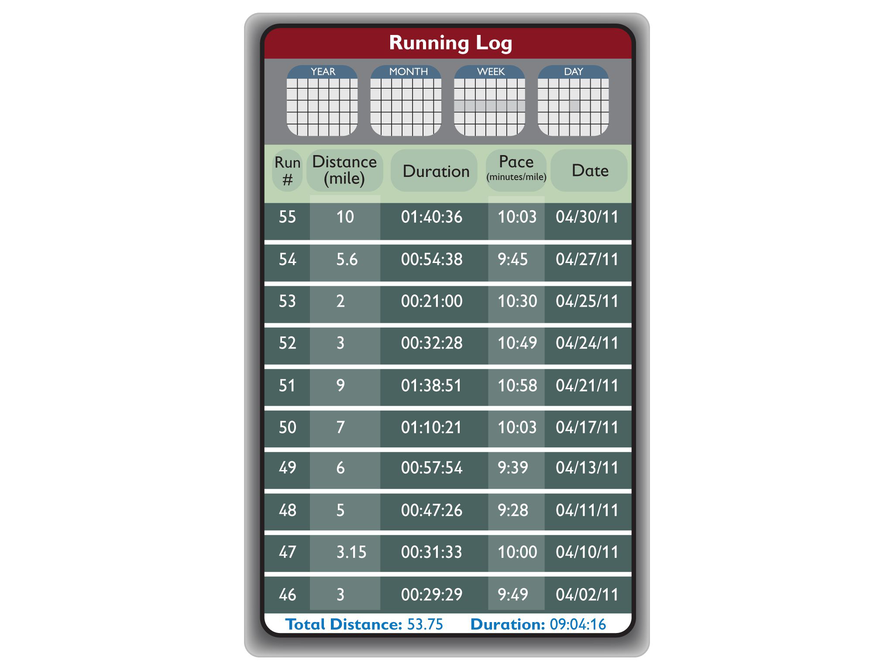
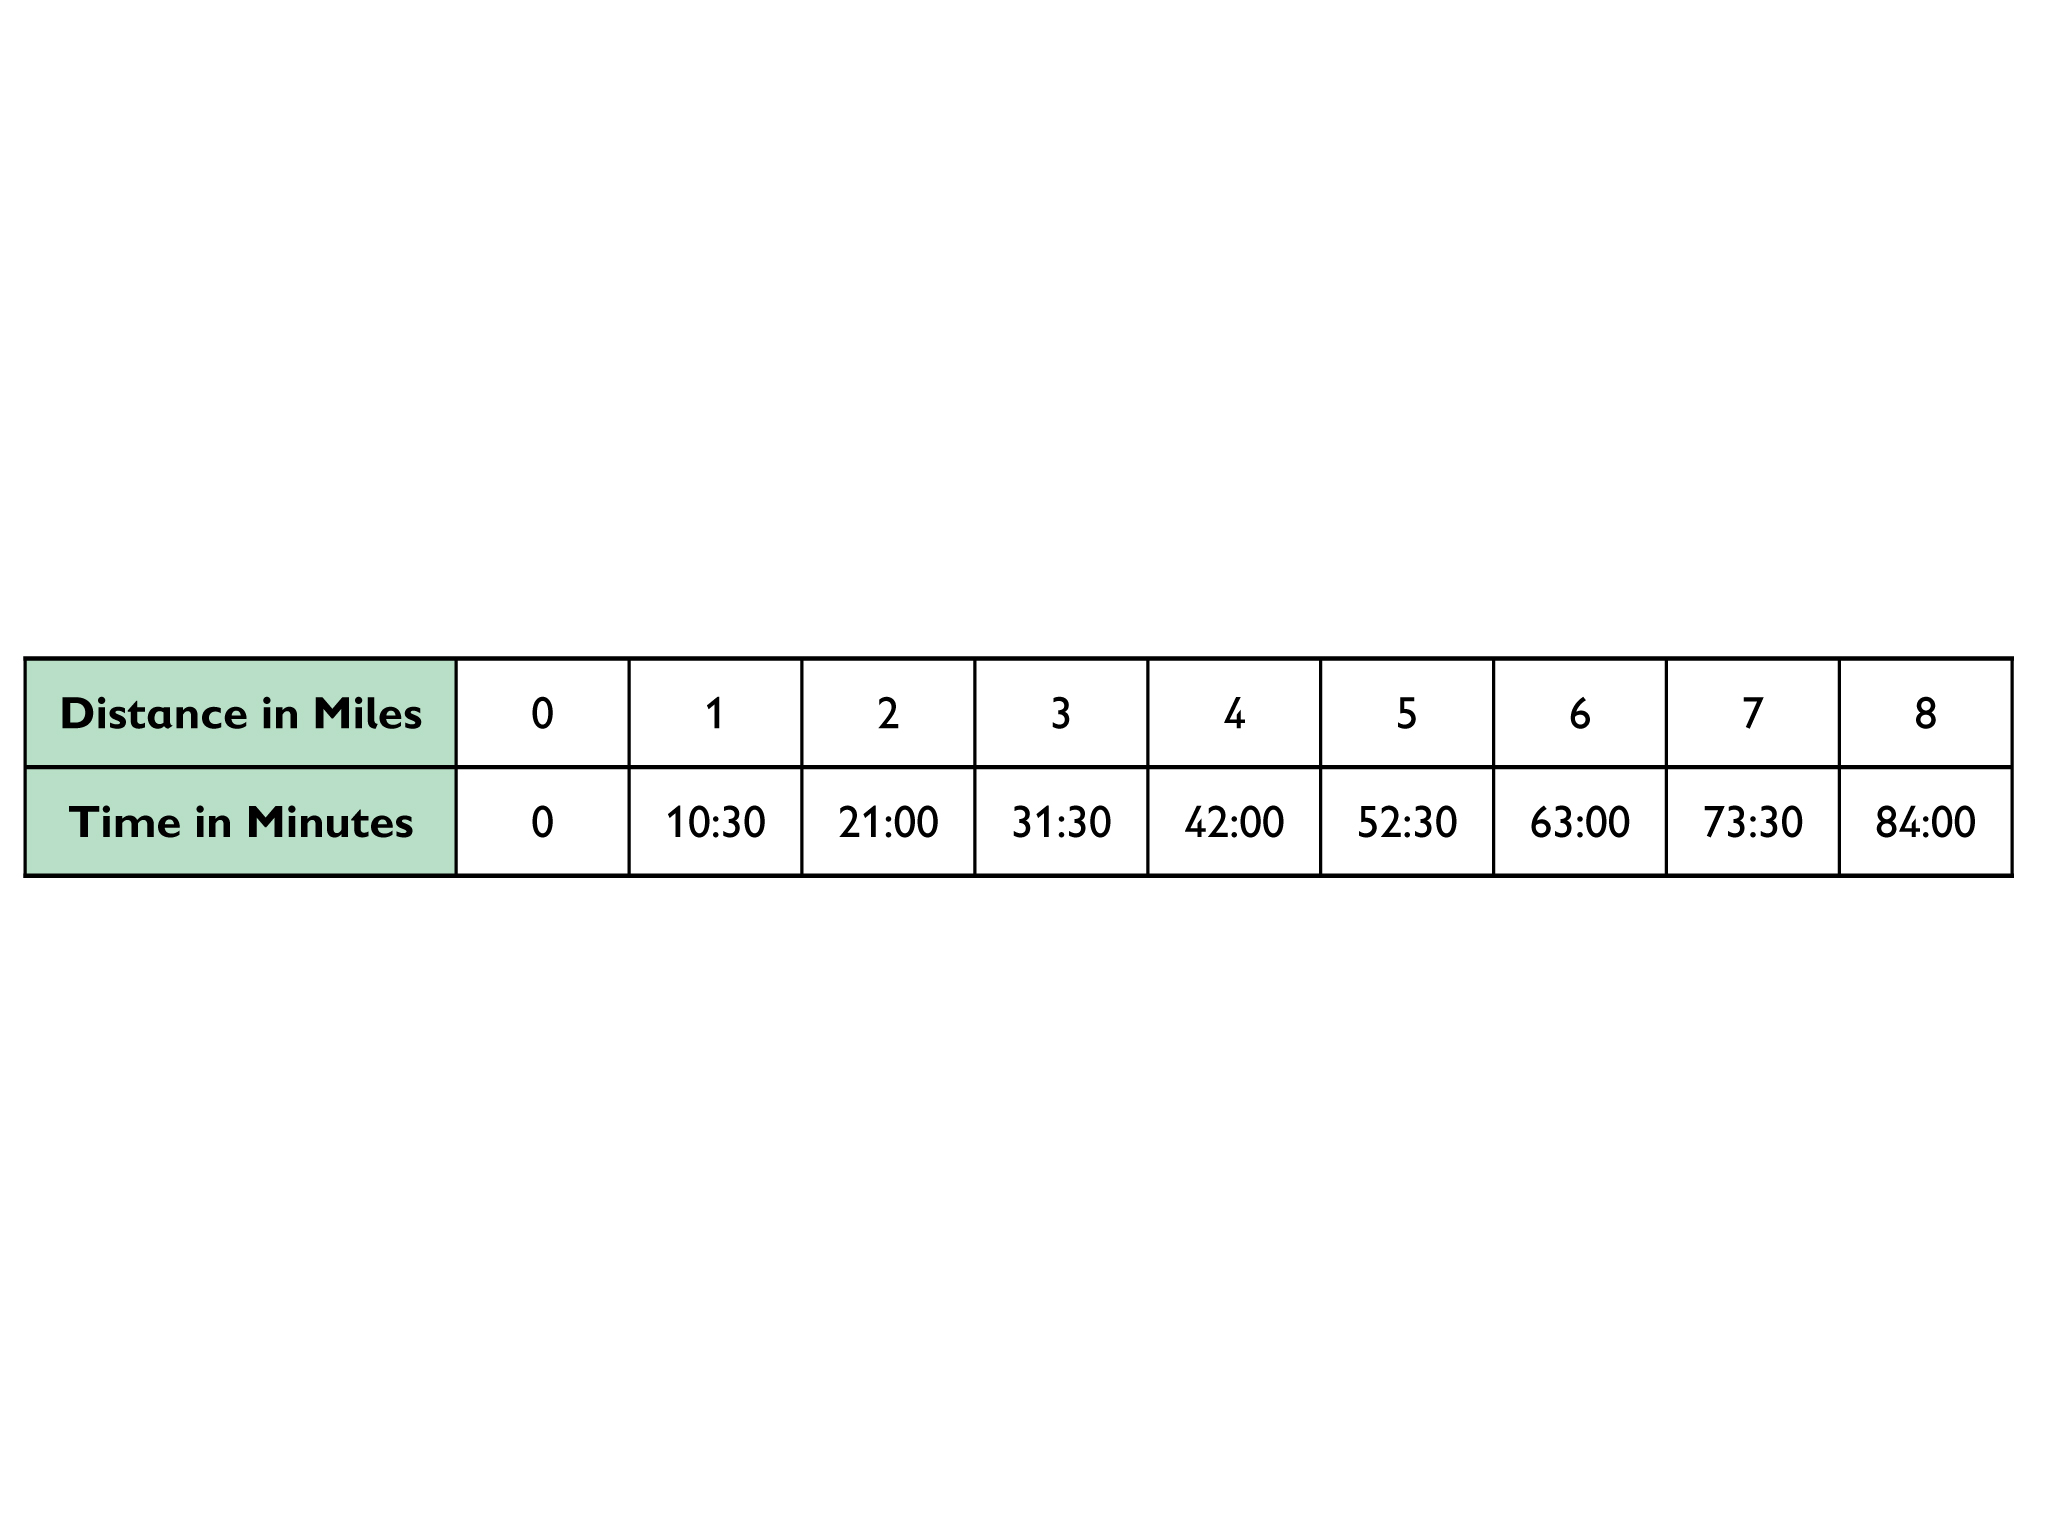
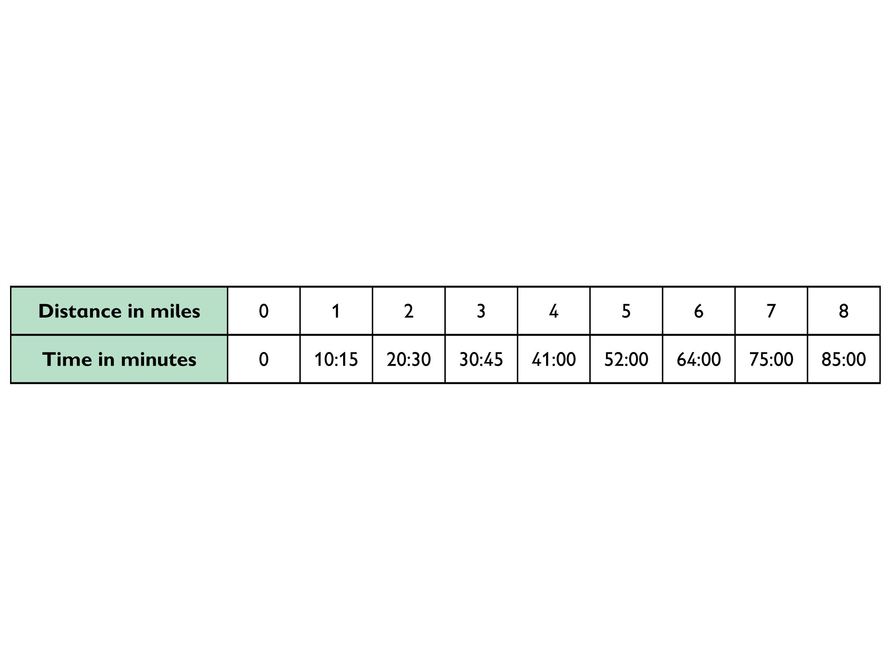
Run 53 shows a pace of 10:30 minutes per mile. John wants to maintain this pace for his next competition run, which is 8 miles long. He makes this running schedule table to be sure he runs exactly at that pace.
- Open and complete the running schedule table.
- Draw the graph of John's intended run with time as independent variable.
- This table contains the data from John's actual run.
- Draw a graph for the actual run in the same coordinate grid that you used to graph the intended run. Describe what happened during John's run.
- What was his average speed?
Best Buy
Answers
Arguments for each choice in problems 1–3 may vary. For example, some students may figure out the price at both markets for the same number of items (e.g., the price for 6 tomatoes at each place in problem 1), rather than the unit price. In doing so, students are using the unit price implicitly, which is fine; the role of the unit price will become explicit in problem 4.
- Tomatoes: If we distinguish tenths of cent, then 6 for $2.99 is a better buy because the unit price is cents, whereas with 4 for $2.00, the unit price is 50 cents. But if we round prices to the nearest penny, then they are equally good buys, because 49.8 cents rounds to 50 cents.
- Cucumbers: 2 for $1.29 is a better buy because the unit price is 64.5 cents, which rounds to 65 cents, and the unit price of 3 for $1.99 is 66.333... cents, which rounds to 66 cents.
- Oranges: 8 for $2.50 is a better buy because the unit price is 31.25, which rounds to 31 cents, and the unit price of 6 for $2.00 is 33.33..., which rounds to 33 cents.
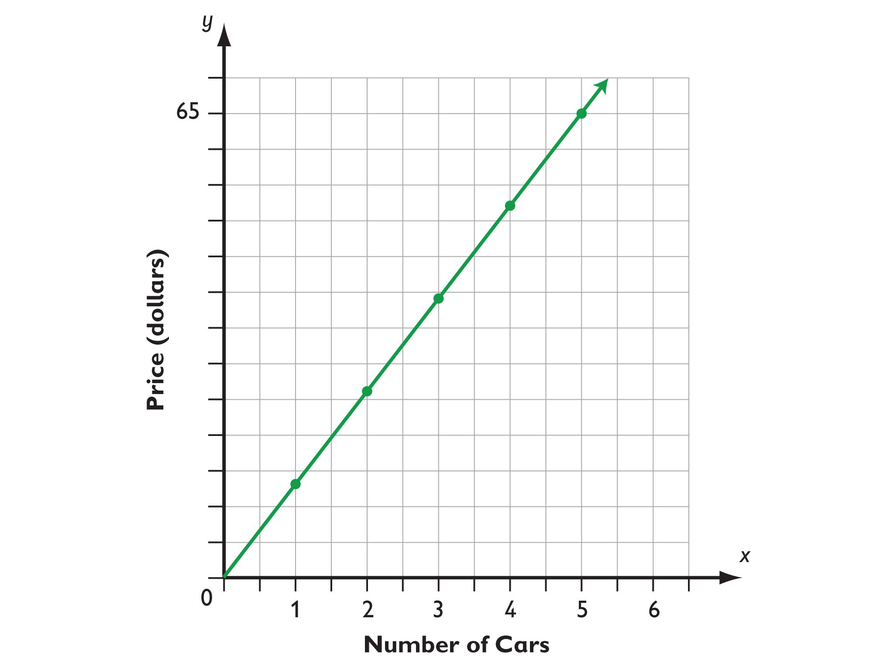
- Graphs should use the x-axis for number of oranges and the y-axis for total cost.
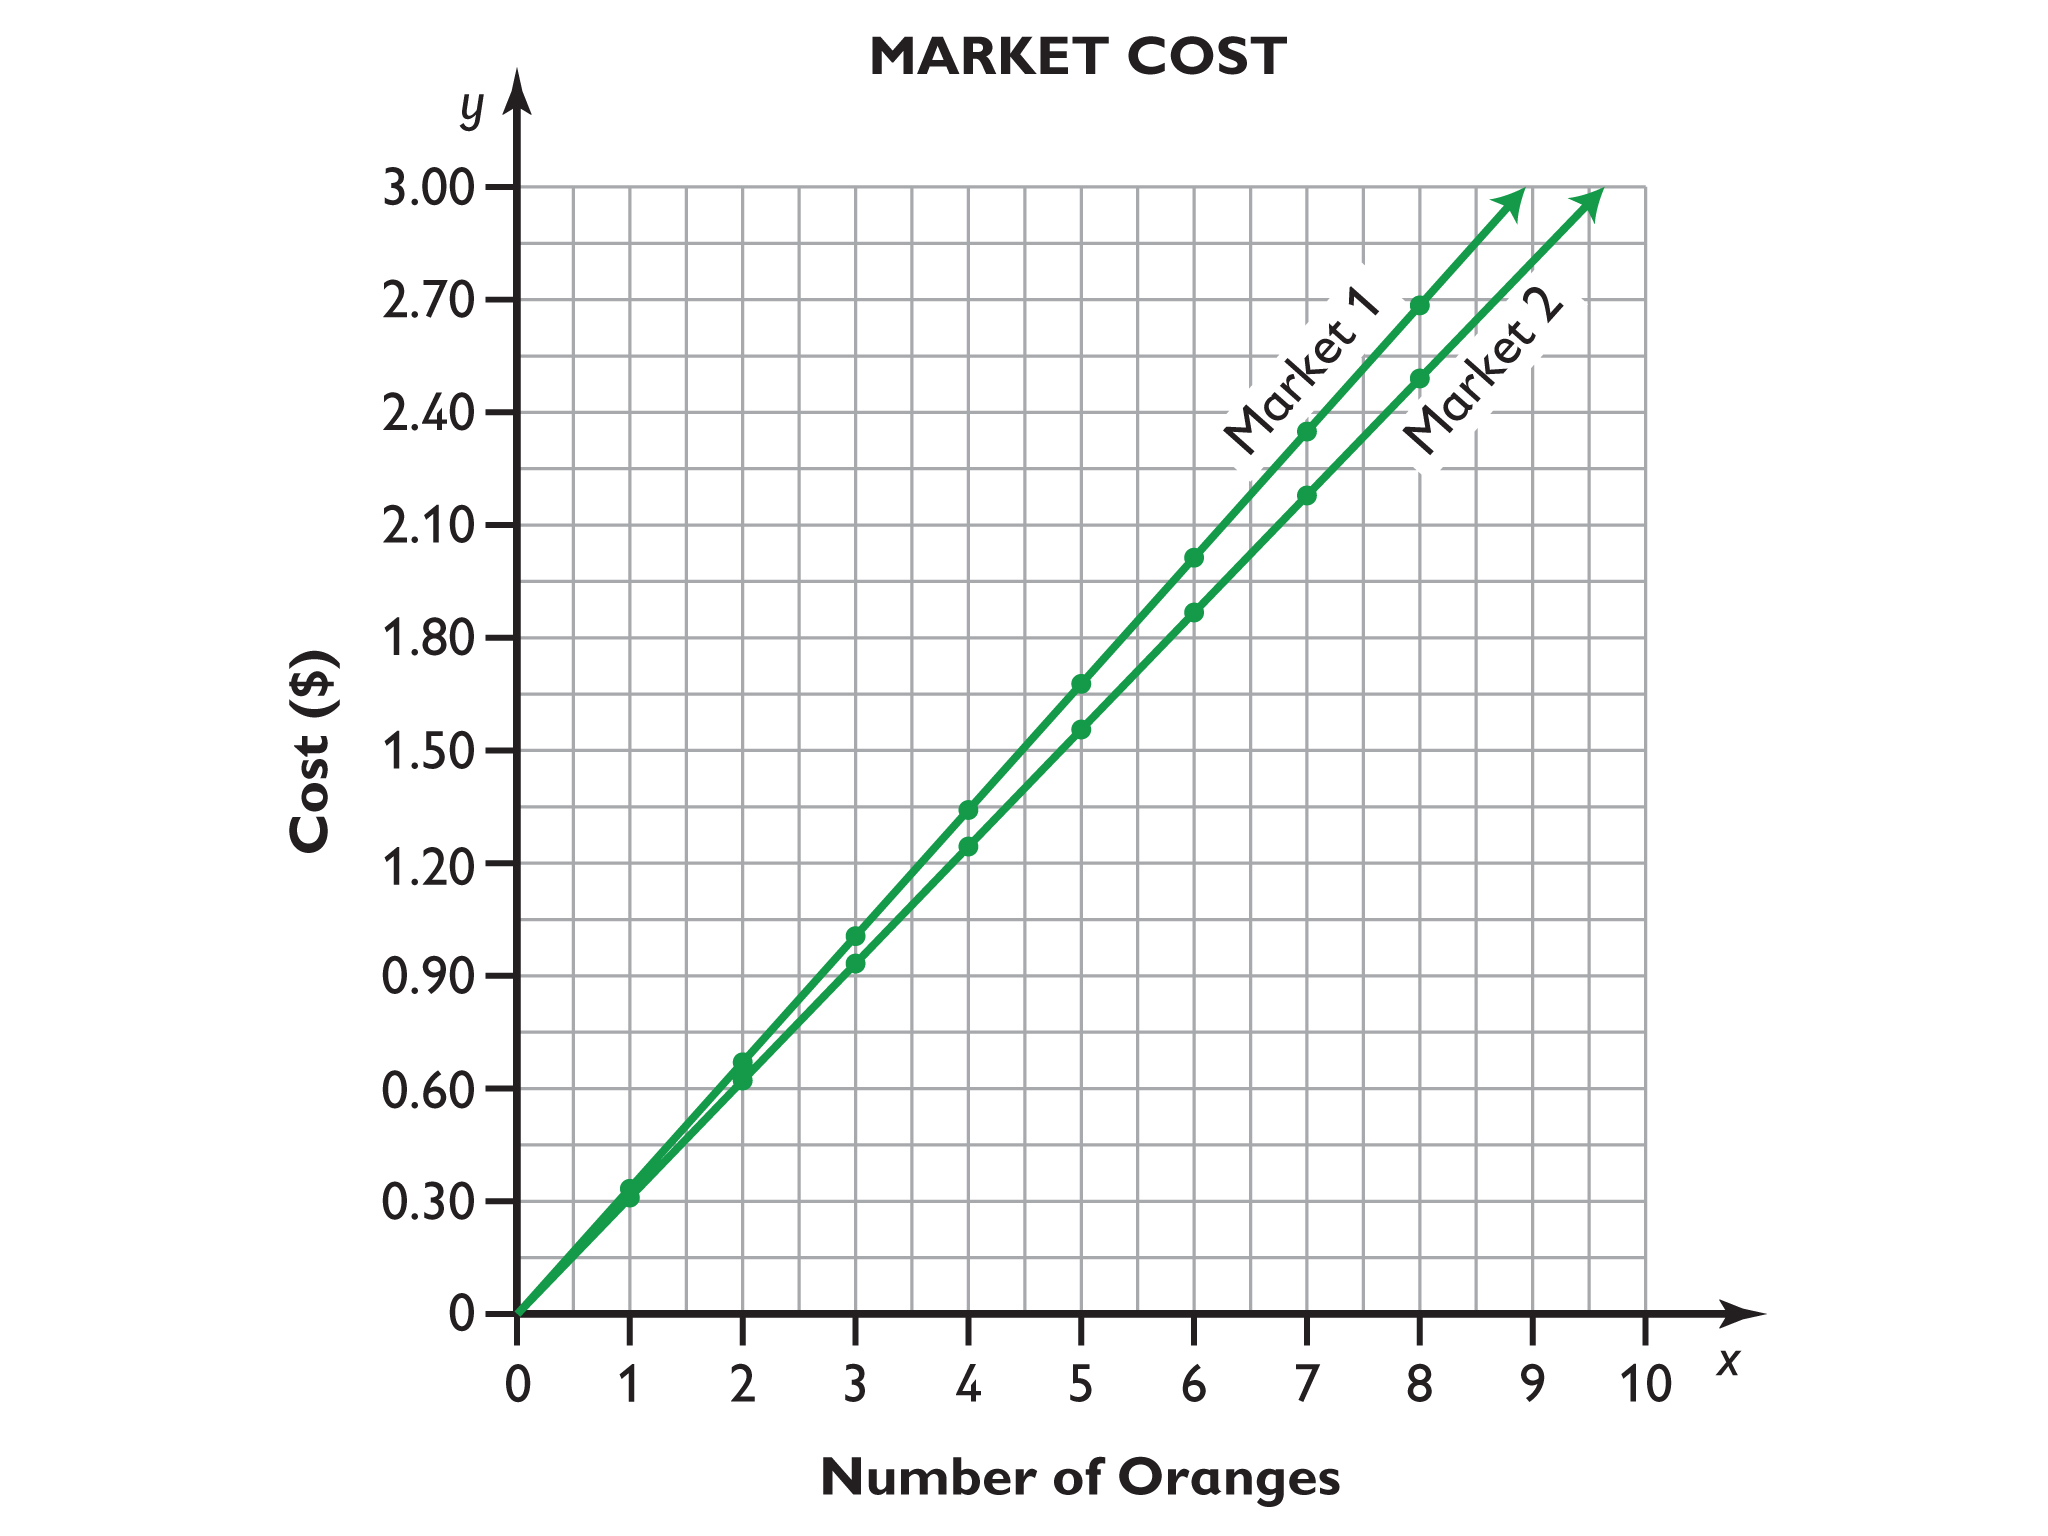
- The constant of proportionality for Market 1 is approximately 0.33 and the constant of proportionality for Market 2 is approximately 0.31.
- A steeper graph means a higher price per item.
Work Time
Best Buy
For problems 1–3, find the better buy and give your argument.
- Tomatoes:
4 for $2.00
6 for $2.99 - Cucumbers:
2 for $1.29
3 for $1.99 - Oranges:
6 for $2.00
8 for $2.50 - Answer the following:
- Use the handout to make a ratio table for the prices of oranges.
- On one coordinate grid, draw the two graphs for the prices of oranges using the graph tool.
- What is the constant of proportionality in each case?
- What does a steeper graph mean in relation to the constant of proportionality?
HANDOUT: Best Buy
Running a Car Wash
Answers
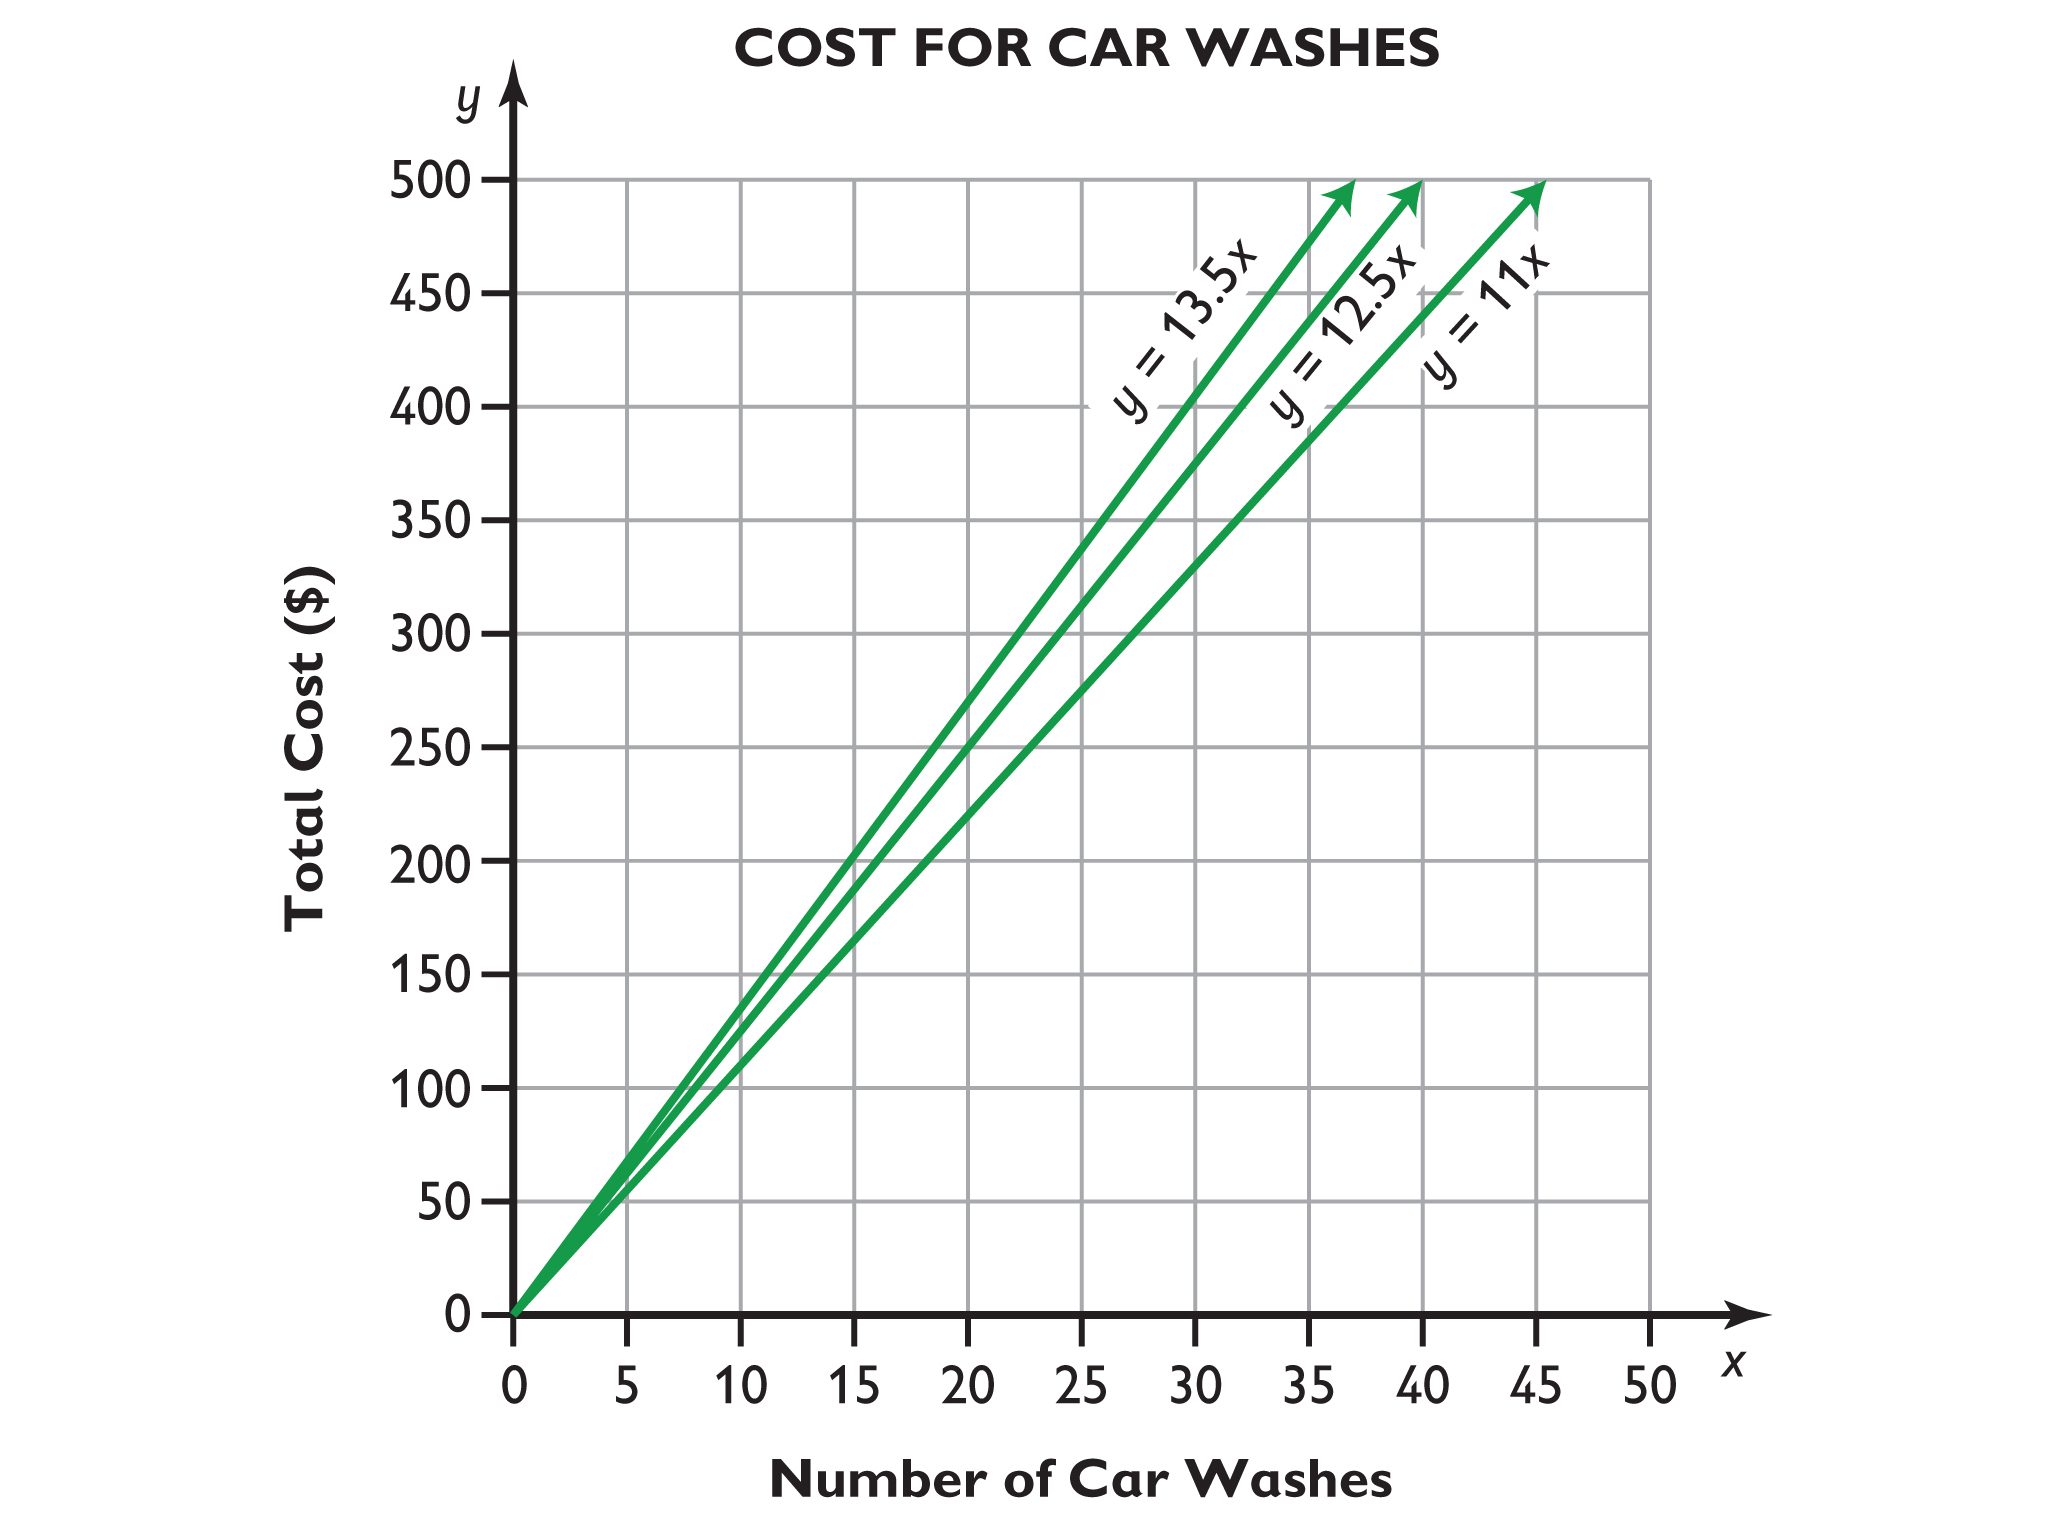
- Students should refer to the graphs by identifying the x-coordinate that corresponds to y = 500 in each case rather than computing anything.
For the first type of wash, 46 car washes are needed. For the second type of wash, 40 car washes are needed. For the third type of wash, 38 car washes are needed. Note that students should recognize the need to round up to the next whole number (rather than simply rounding to the closest whole number) because rounding down will decrease the total amount earned below $500.00. - Answers will vary, but students should see that Karen is estimating that she will earn an average of $6.50 per car wash in the self-wash section. Her estimate is based on the 6-minute average time it takes to wash a car, which means $4.50 since 6(0.75) = 4.5, plus the $2.00 initial fee. $4.50 + $2.00 = $6.50 per car wash. In her formula, x is the number of self-washes, and it is multiplied by 6.5. The variable y is the amount earned from self-washes.
- Graph including y = 6.5x follows:
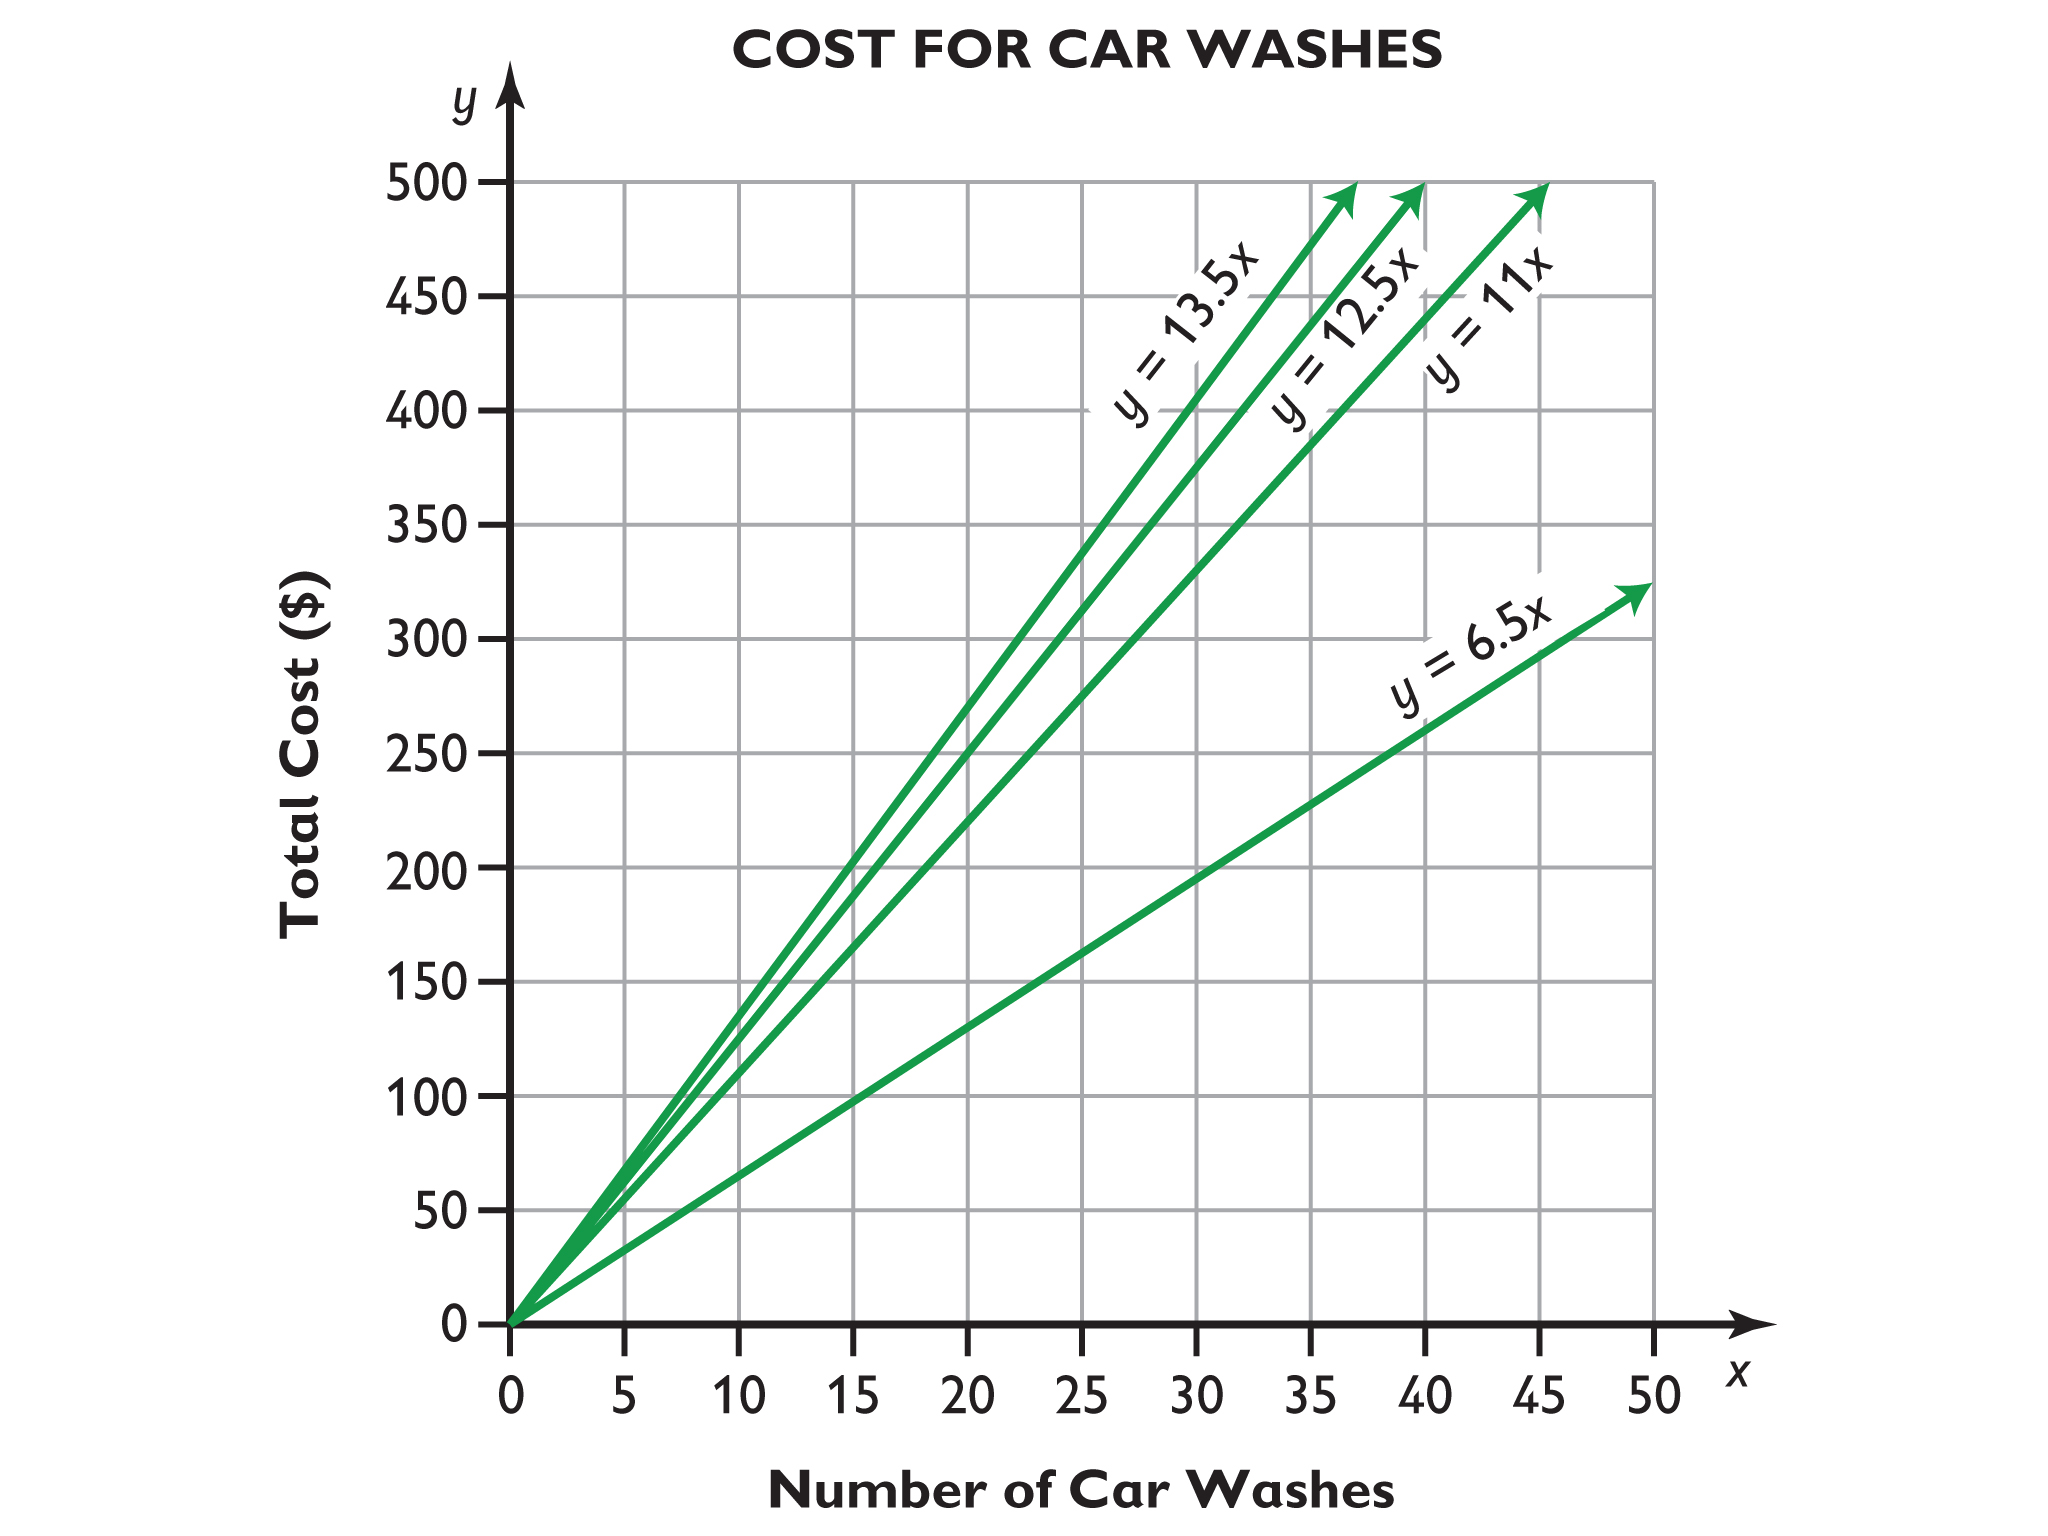 Discussions will vary, but students should see from the graphs that Maya will make the most money if all 50 customers use the $13.50 car wash, the least money if all 50 customers use the self-wash, and somewhere in between if customers use a mix of car wash types.
 - $13.00
- The formula y = 0.75x + 2 shows the cost for a single wash in the self-wash section, where x is the number of minutes the person spent washing their car, and y is the total cost for the wash.
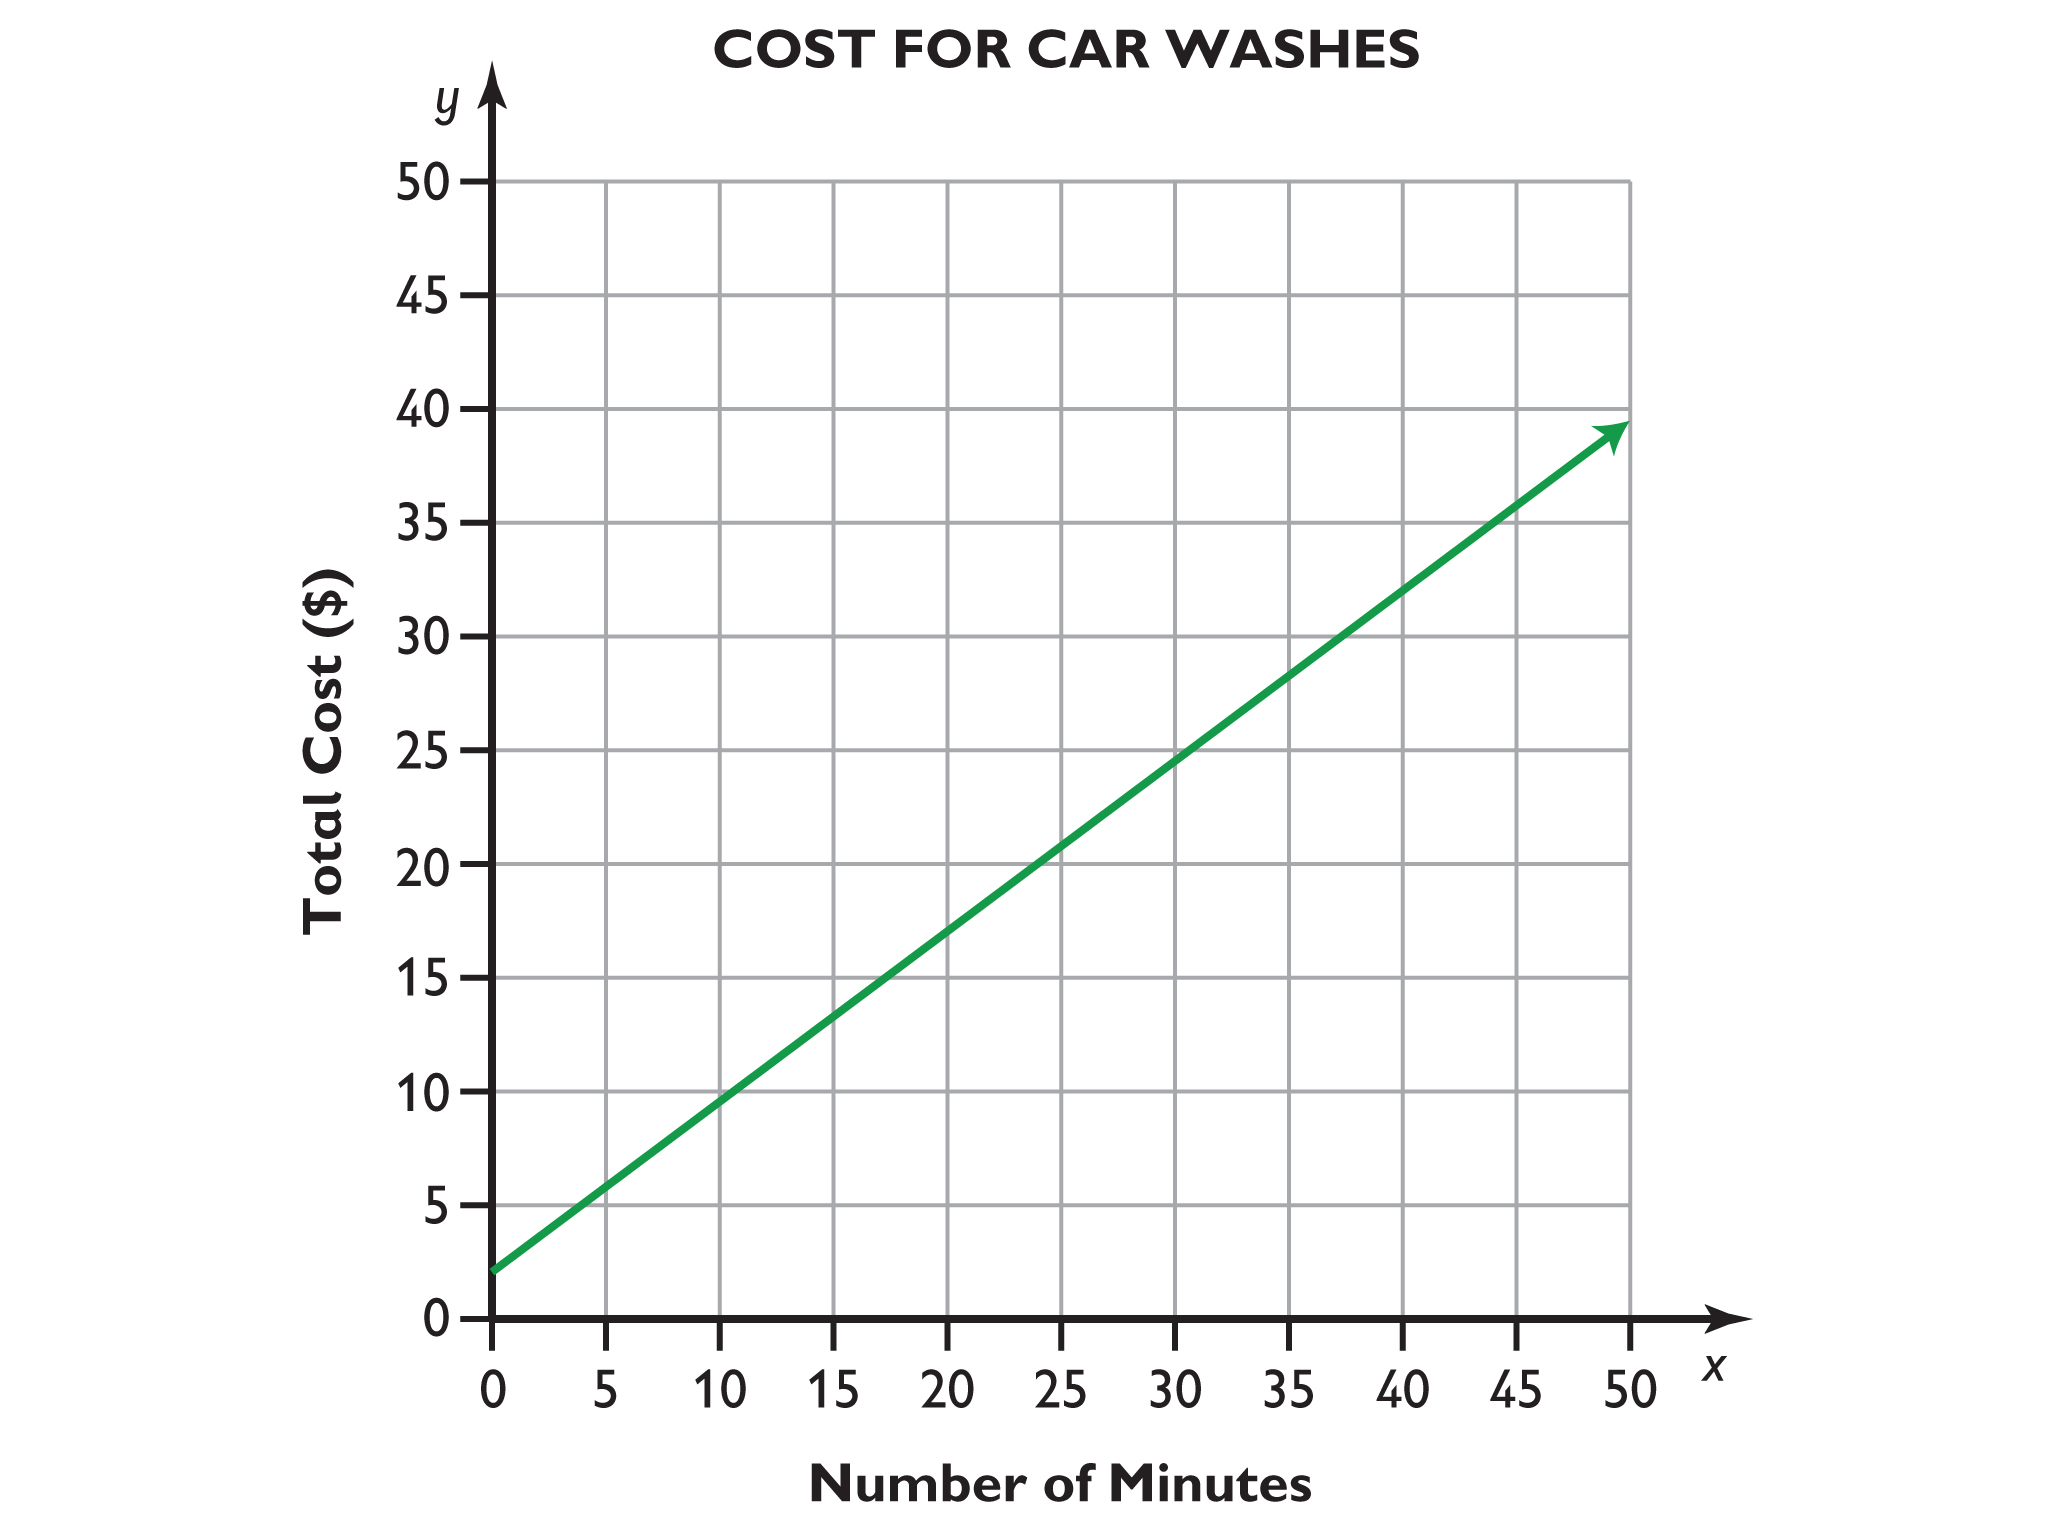
- No, it is not a proportional relationship. At this point, students should not be expected to be able to explain why it is not a proportional relationship, but do ask them how they know. To pursue the question more directly, have them make a table of values and check the ratio between corresponding pairs of values for several pairs. You might also ask them to notice where the graph intersects the y-axis.
Work Time
Running a Car Wash
Maya is considering opening a car wash.
When you ride your car through the washer, you can get three different types of washes at three different prices: $11, $12.50, and $13.50.
When you wash your car yourself, the price depends on the time you spend. There is a base fee of $2 plus $ 0.75 per minute. On average, it takes about 6 minutes to clean a car.
- Graph y = 11x, y = 12.5x, and y = 13.5x. The variable x is an independent variable, and x runs from 0 to 50.
- Maya wants to know how many of each type of car wash are needed to make $500.00 from each type of wash. Solve this problem using the graphs.
- Maya wants to get an easy formula for how much she will earn from the self-wash section. Her friend Karen suggests the formula y = 6.5x.
Draw Karen's graph on the same coordinate grid. Discuss with a partner what the four graphs tell you about the money Maya makes when she gets about 50 cars per day, each using one of the four types of wash.
Finally, after reflecting all options she decides to draw a fifth graph on the coordinate grid. The fifth graph is shown on the right.
What price per car does Maya charge, according to this graph?
There is also another formula that Maya uses for her car wash:
y = 0.75x + 2- Explain the meaning of this formula.
- Create the graph.
- Is this the graph of a proportional relationship?
Stacking Tires
Answers
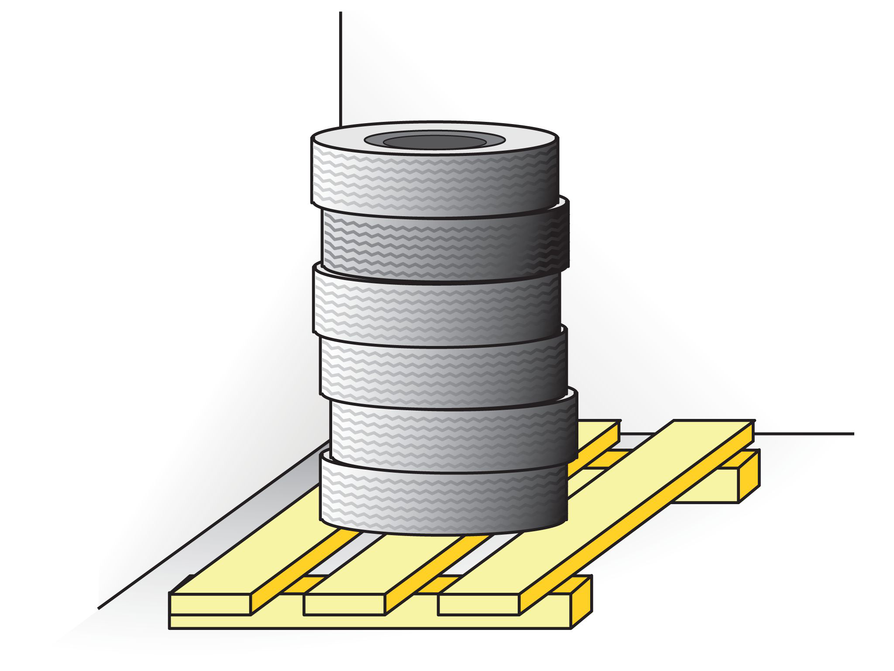
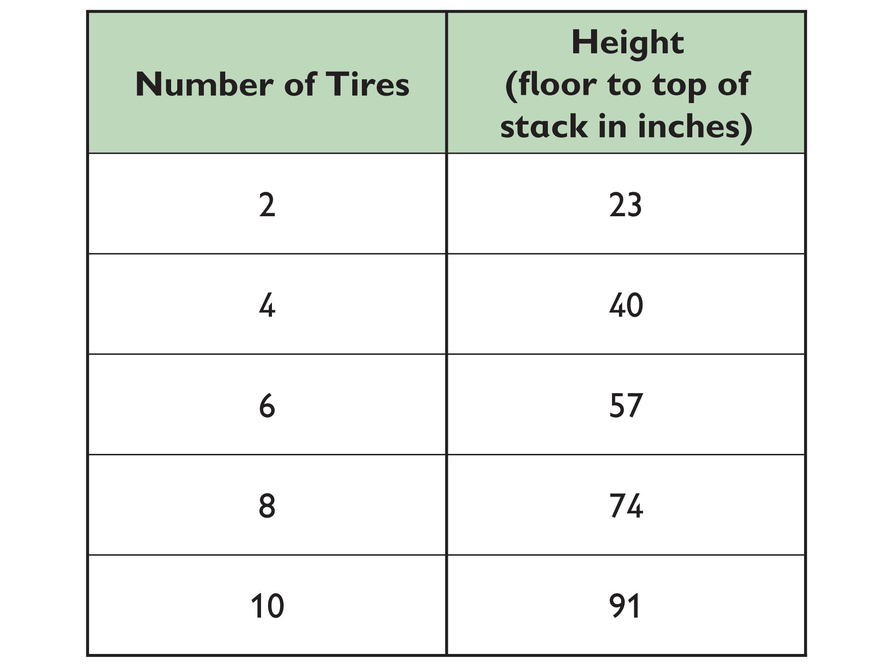
- Based on the table, first find the height of 2 tires. 40 in. – 23 in. = 17 in. = the height of 2 tires. = 8.5 in. per tire. Each tire adds 8.5 inches to the stack.
- Based on the table, 23 inches equals the height of 2 tires plus the height of the pallet. From question 1, you know that the height of 2 tires equals 17 inches. 23 in. – 17 in. = 6 in. = the height of the pallet.
- Convert the height of the room to inches. The height of the room is the distance from the floor to the ceiling: Height of the room = 10 ft = 120 in. Subtract the height of the pallet: 120 in. – 6 in. = 114 in. = height available for the tires. Divide that height by the height of each tire: 13.4 tires. 13 tires can be stacked on the pallet.
Work Time
Stacking Tires
Identical new tires are stacked on a pallet in the corner of a garage.
The garage ceiling is 10 feet from the floor.
This table shows the height for the stack of tires on the pallet in terms of the number of tires in the stack.
Use the table to answer these three questions.
- How much height does each tire add to the stack? Explain how you know your answer is correct.
- How high is the pallet? Explain how you know your answer is correct.
- How many tires can be stacked on the pallet before the stack of tires reaches the 10-foot ceiling? Explain how you know your answer is correct.
Postal Rates
Answers
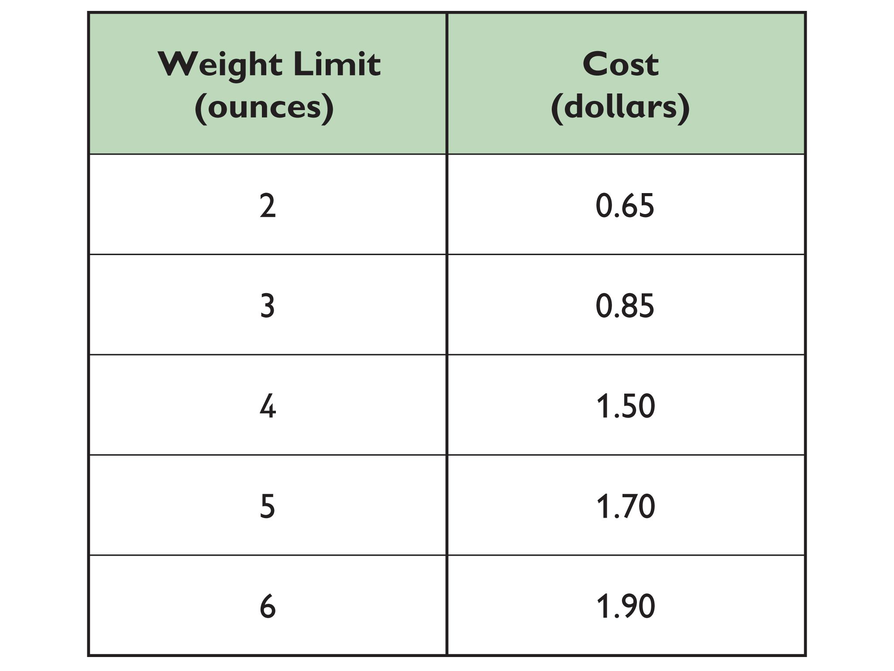
No, it is not proportional because there is no constant of proportionality. If we divide cost by weight for a 2-ounce letter, we get 32.5 cents per ounce:
But if we divide cost by weight for a 3-ounce letter, we get a different cost per ounce:
Work Time
Postal Rates
The cost to mail a letter depends on its weight. This table of values is used by the U.S. Postal Service for first-class mail.
- Based on these values, is the relationship between weight and cost proportional? Justify your answer.
Recycling
Answers
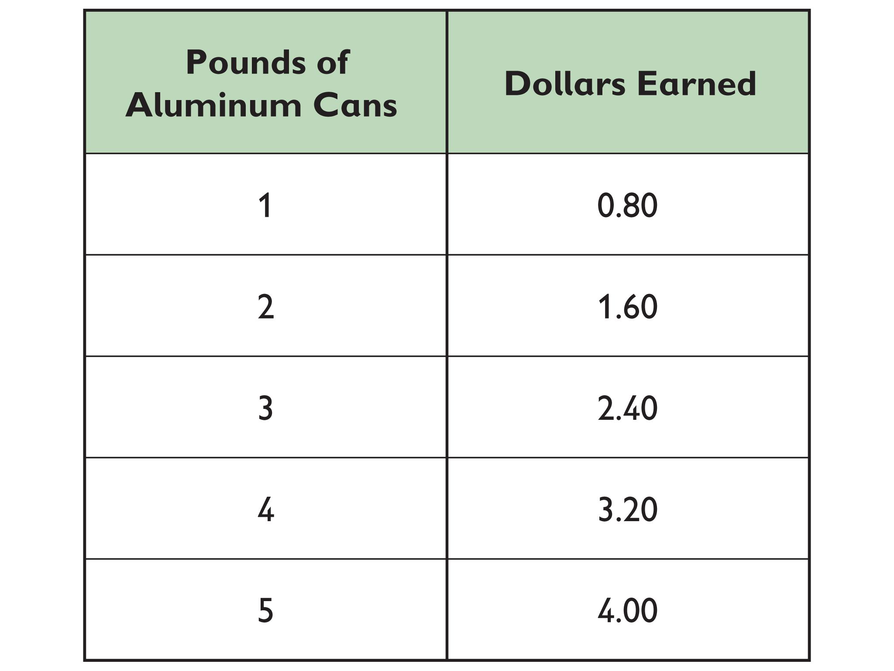
- 80¢
- 2.5 lb × 0.8 dollars per lb = 2 dollars
- 15 lb × 0.8 dollars per lb = 12 dollars
- 36 dollars ÷ 0.8 dollars per lb = 45 lb
- 1 dollar ÷ 0.8 dollars per lb = 1.25 lb
Work Time
Recycling
This table of values shows the amount of money Carl earns for recycled aluminum cans.
Use the table of values to answer questions 1–5.
- How much money does Carl earn for each pound of aluminum cans?
- How much will Carl earn when he recycles exactly 2.5 pounds of cans? Show your work.
- How much money will Carl earn when he recycles 15 pounds of cans? Show your work.
- One day, Carl earns $36. How many pounds of cans did he recycle? Show your work.
- How many pounds of cans must Carl recycle to earn $1? Show your work.
Tiling Models
Answers
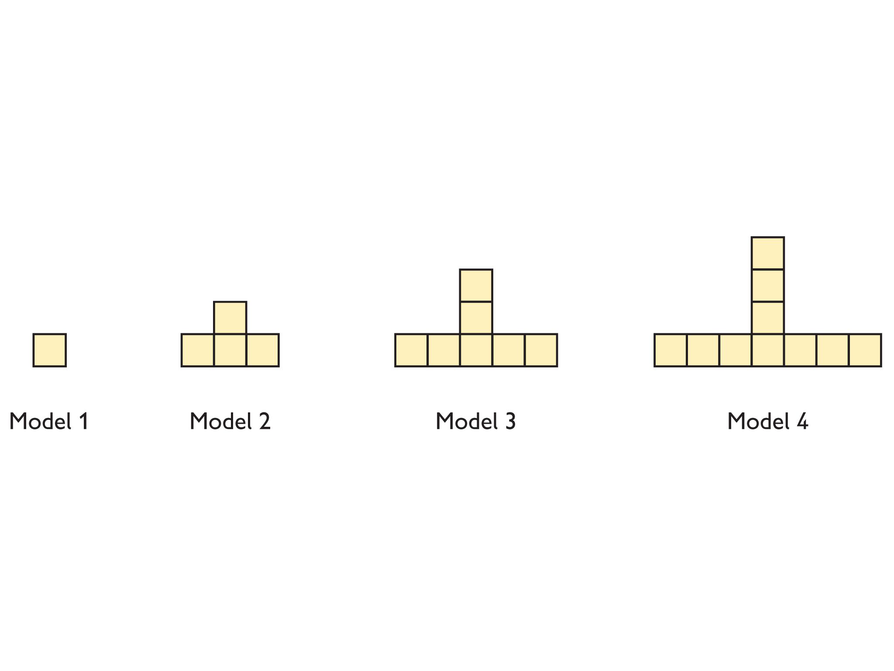
- There are 13 tiles in model number 5.
 Each model has three legs. There is also one center tile. Each leg has one fewer tile than the model number.
 - There are 148 tiles in model number 50. The model has 3 legs. In model 50, each leg has 49 tiles. There is one center tile. (3 legs × 49 tiles per leg) + 1 = 148 tiles
- To find the number of tiles, t, in terms of the model number, m, subtract 1 from the model number; multiply the result by 3 (the number of legs); and add 1 (for the center tile) to that result.
t = 3(m – 1) + 1 t = 3(m – 1) + 1
79 = 3(m – 1) + 1
Start with 79 tiles and subtract 1 (for the center tile): 79 – 1 = 78 tiles
Divide the result by the number of legs: tiles per leg
Add one to get the model number: 26 + 1= 27
Model 27 is the model with exactly 79 tiles.
- To find the model number, m, in terms of the number of tiles, t, subtract 1 from the number of tiles, since the center tile is one “extra” tile; divide that result by 3 (the number of legs) to get the number of tiles per leg; add one (the middle tile) to that result to get the model number.
Let t = number of tiles; let m = model number.
t = 4(m –1) + 1t = 4m – 4 + 1
t = 4m – 3
Work Time
Tiling Models
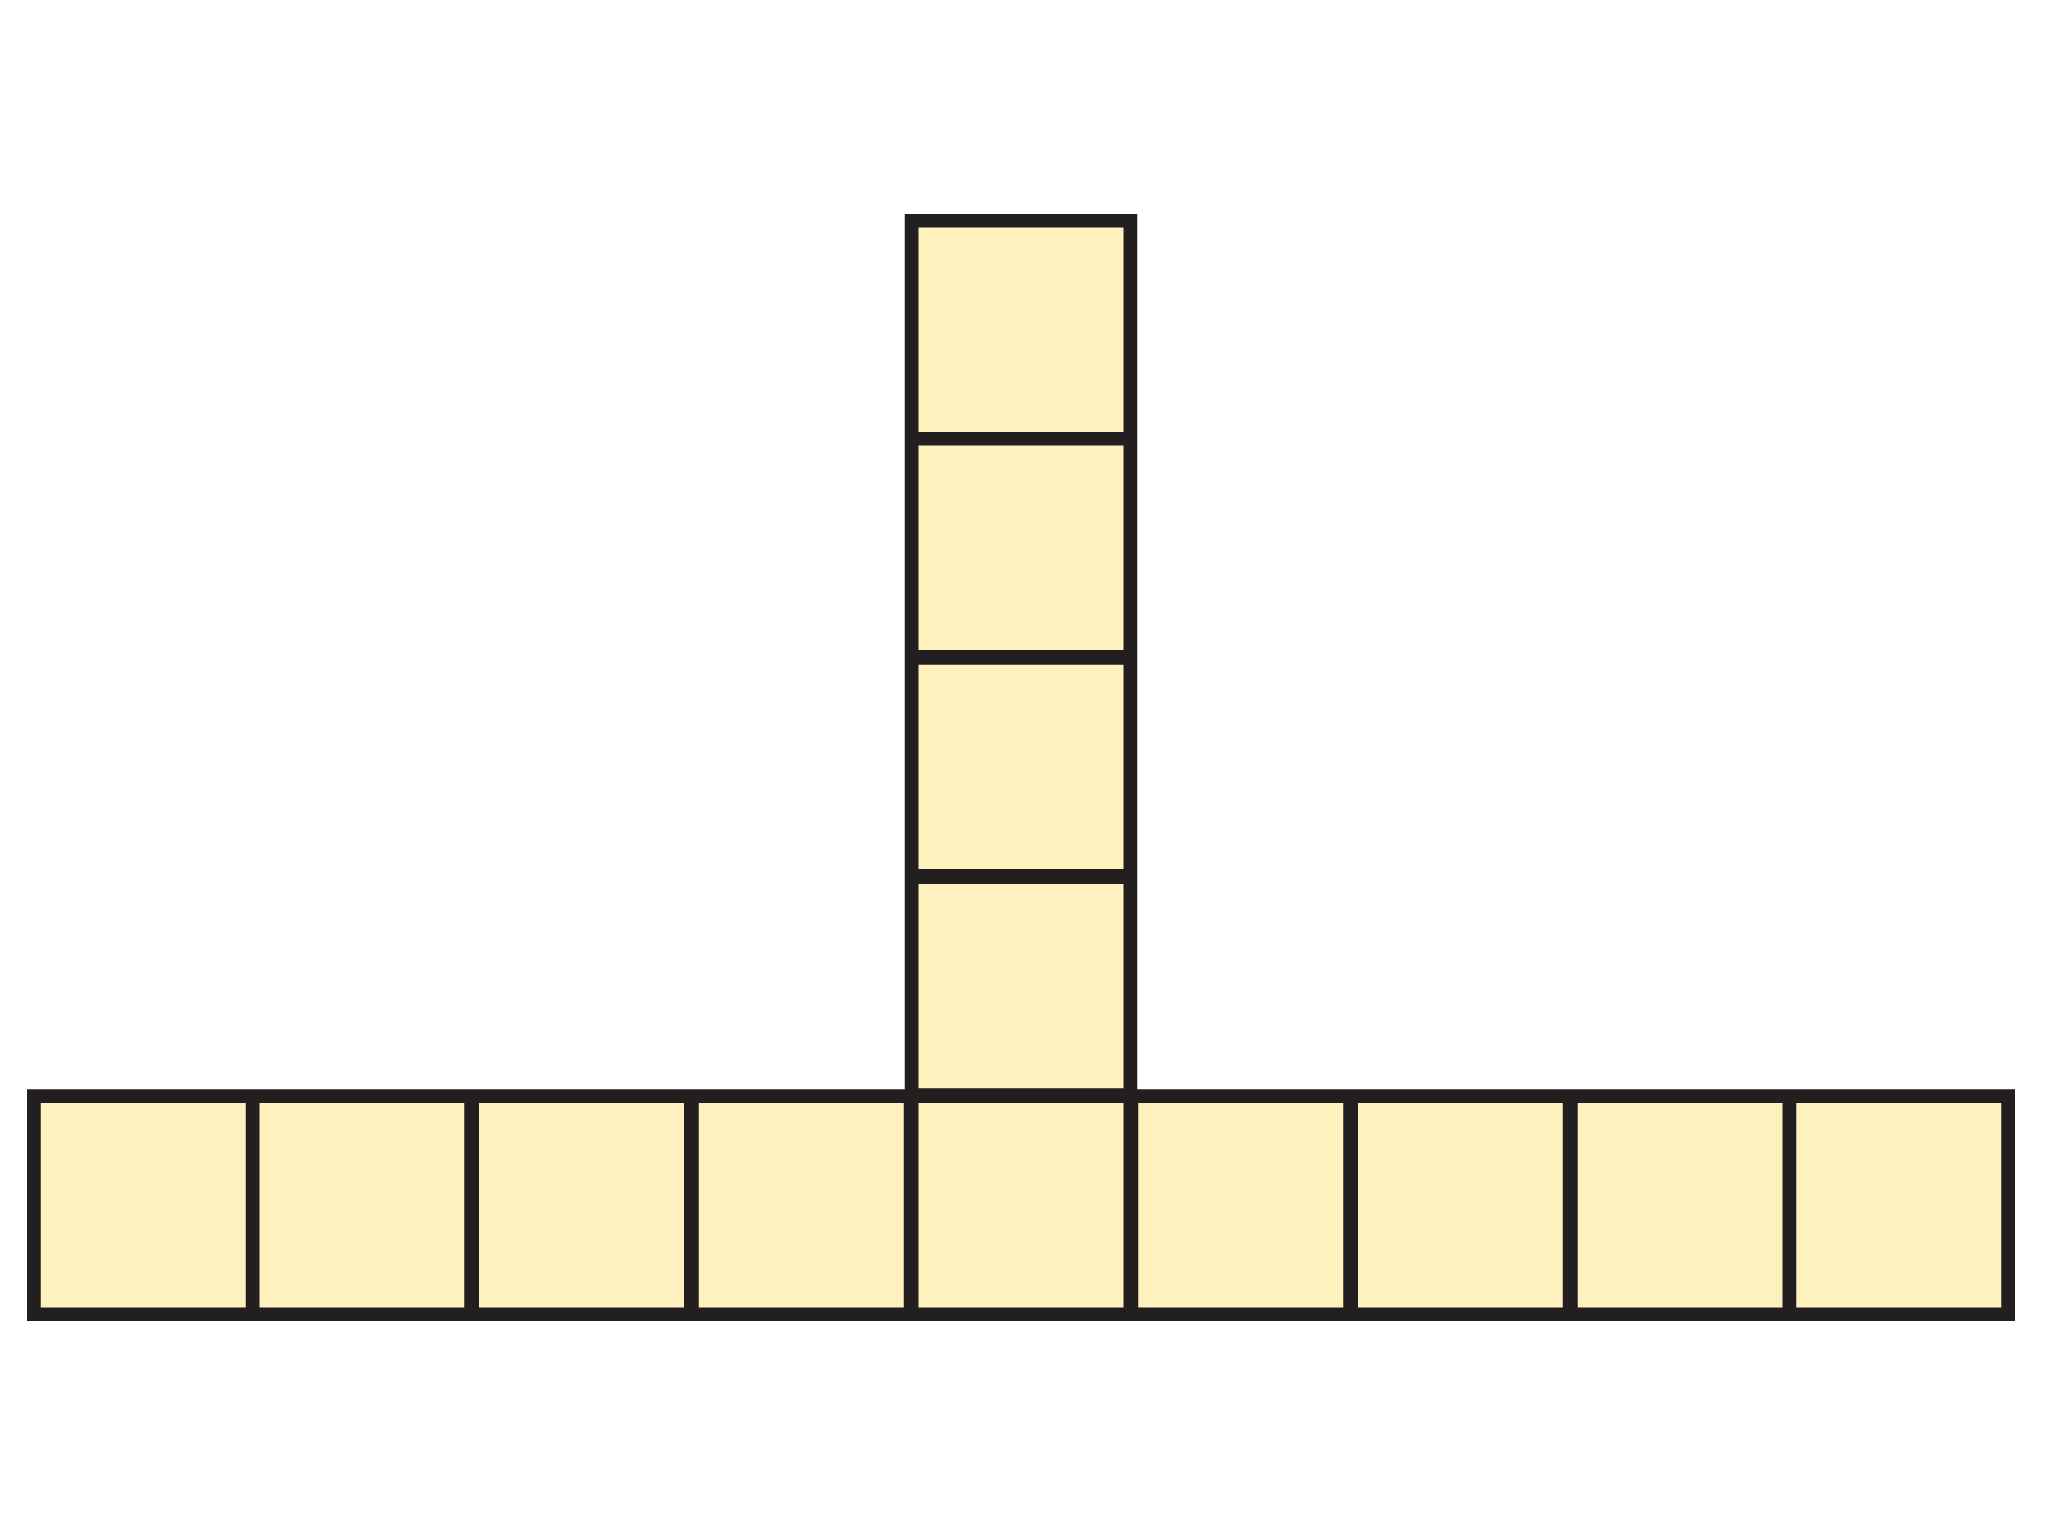
Sophie built models using square tiles. The models keep increasing in the same way.
- How many square tiles are in model number 5? Show how you figured it out.
- How many square tiles are in model number 50? Show how you figured it out.
- If you know the model number, how can you figure out the number of square tiles?
- What model number has exactly 79 tiles in it? Show how you figured it out.
- If you know the number of tiles, how can you figure out the model number?
Now Sophie builds a new set of models, like the image shown above. If you know the model number, how can you figure out the number of square tiles?
- If you know the number of tiles, how can you figure out the model number?
Two Walkers
Answers
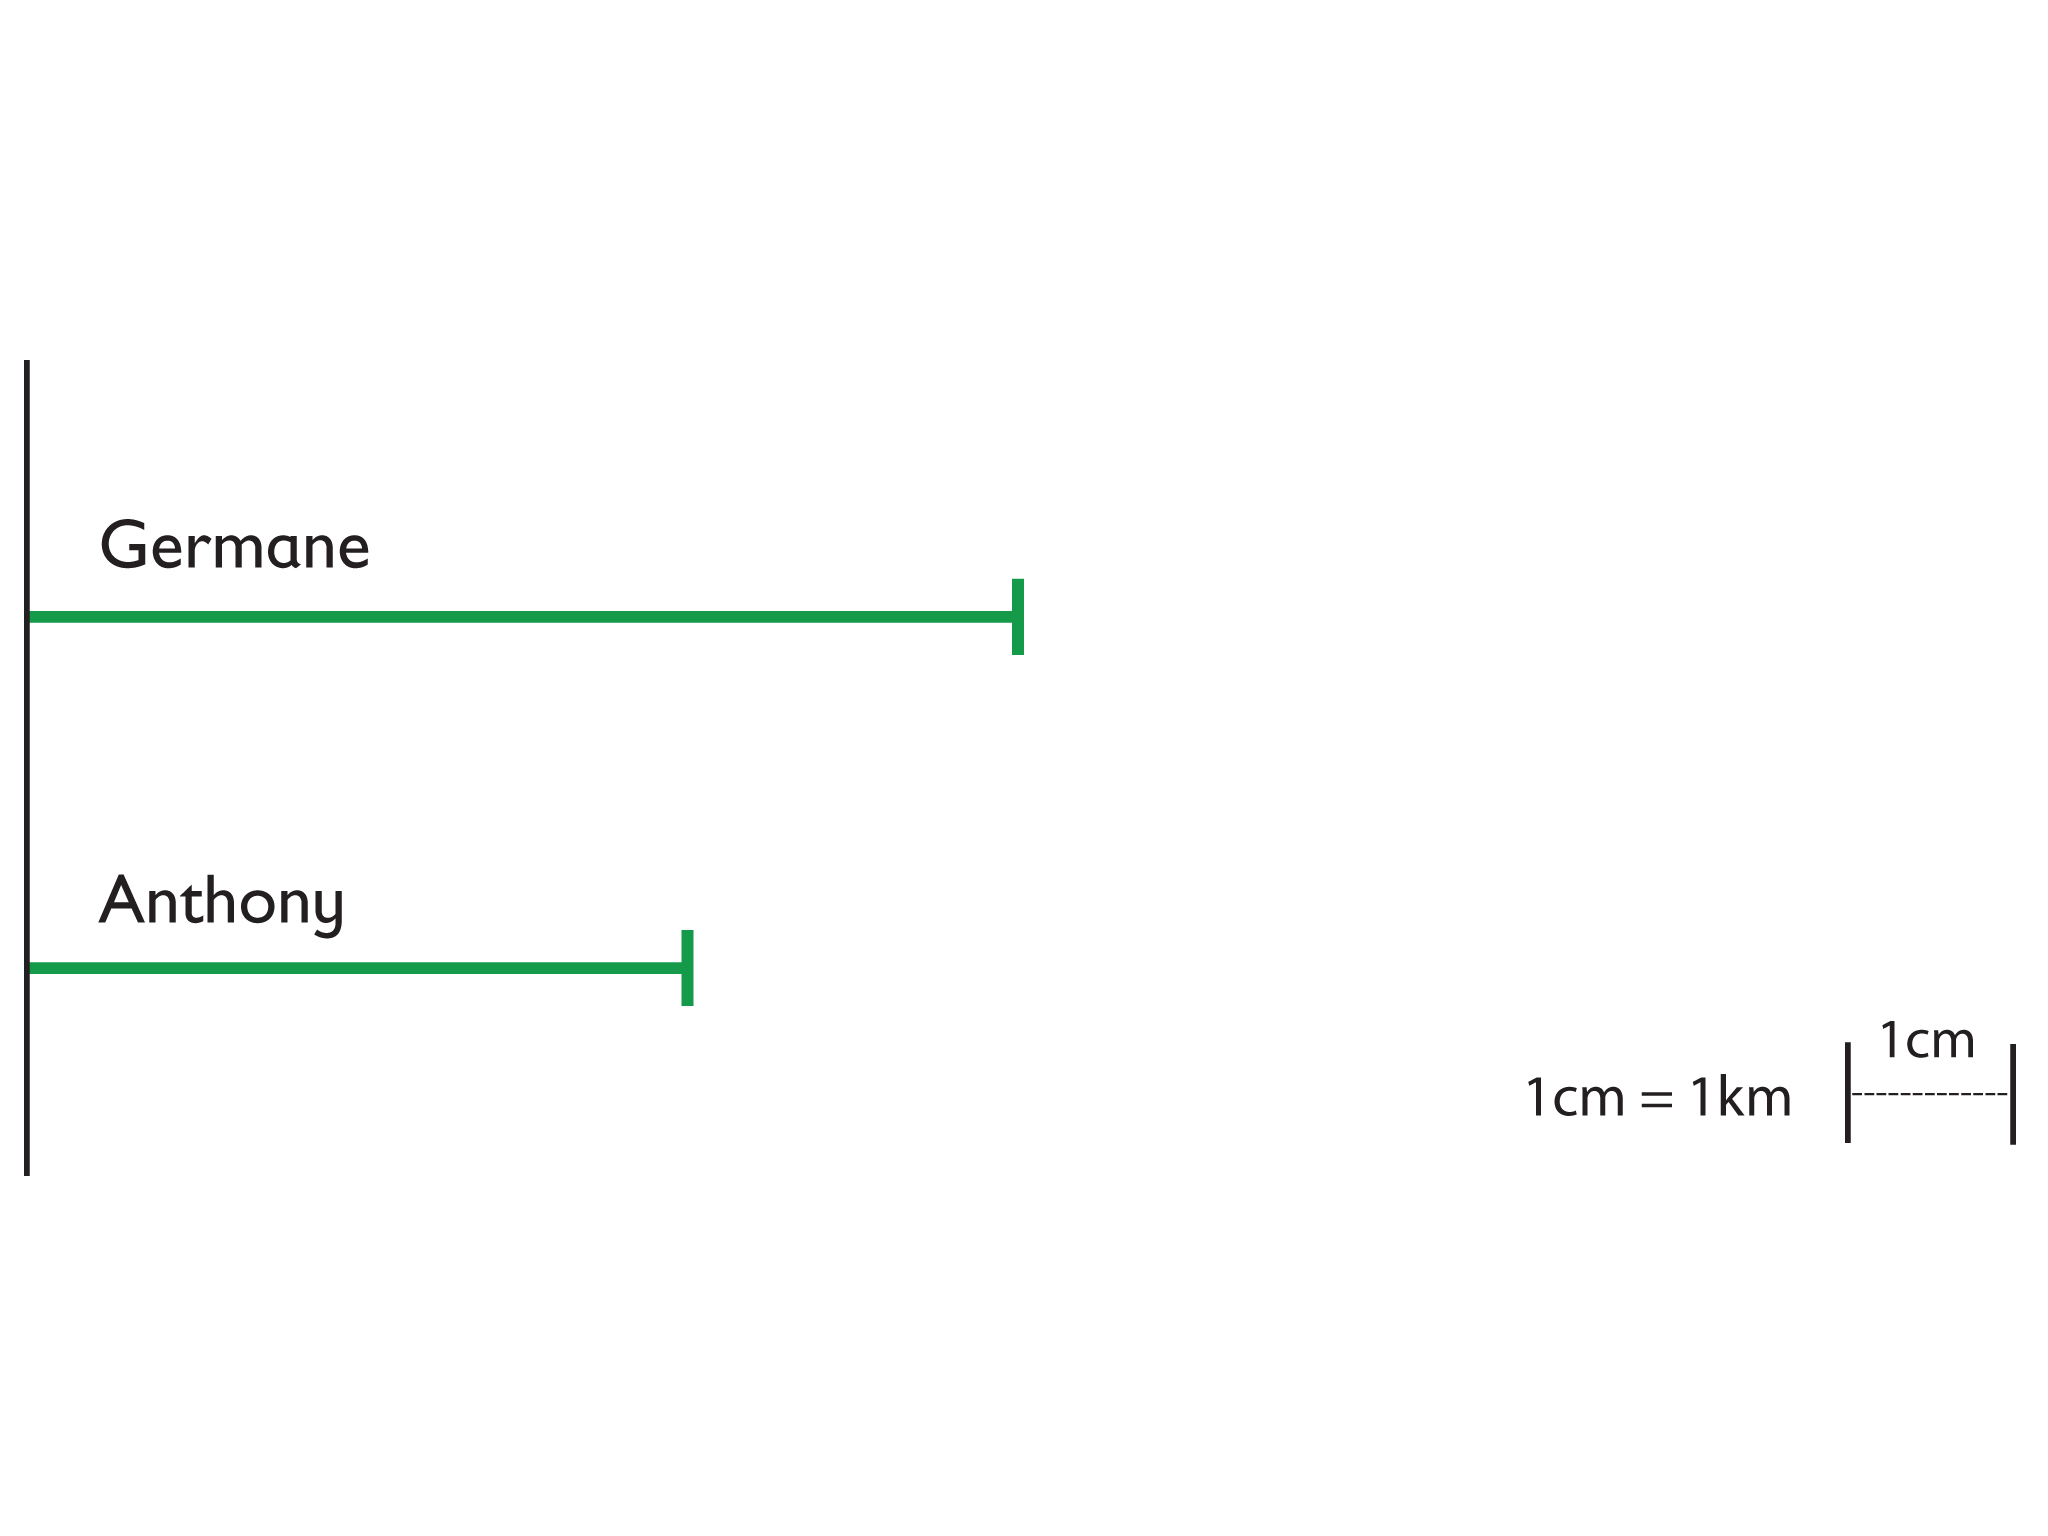
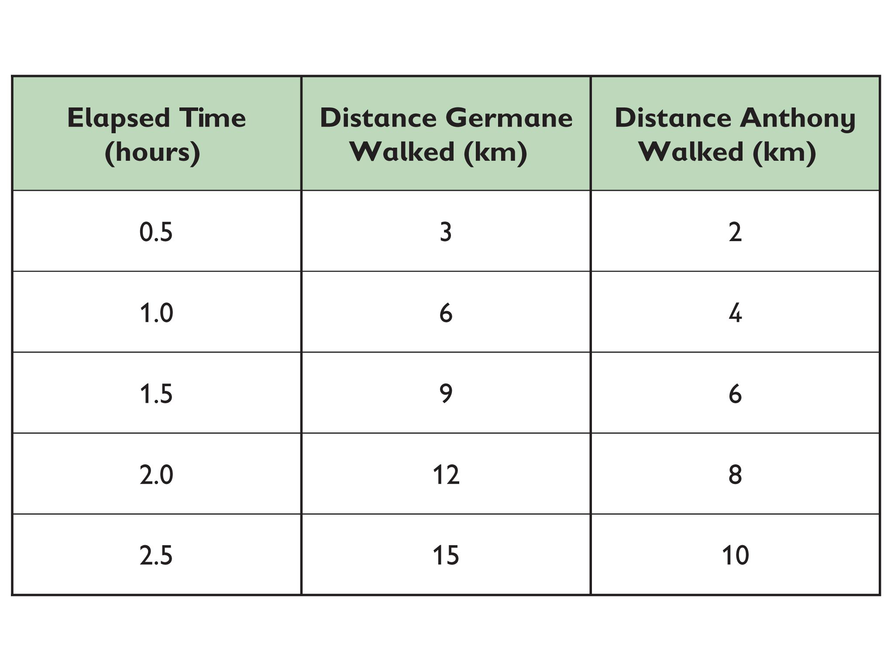
- The table shows that for every 2 km Anthony walked, Germane walked 3 km during the same time period. So Germane walks 1.5 times as far as Anthony in any period of time.
Work Time
Two Walkers
Germane and Anthony are in a walk-a-thon together. They start walking at the same time. The table shows their progress.
- Make a scale drawing with lines showing how far each boy has walked at the end of 1 hour. Use this scale: 1 cm represents 1 km.
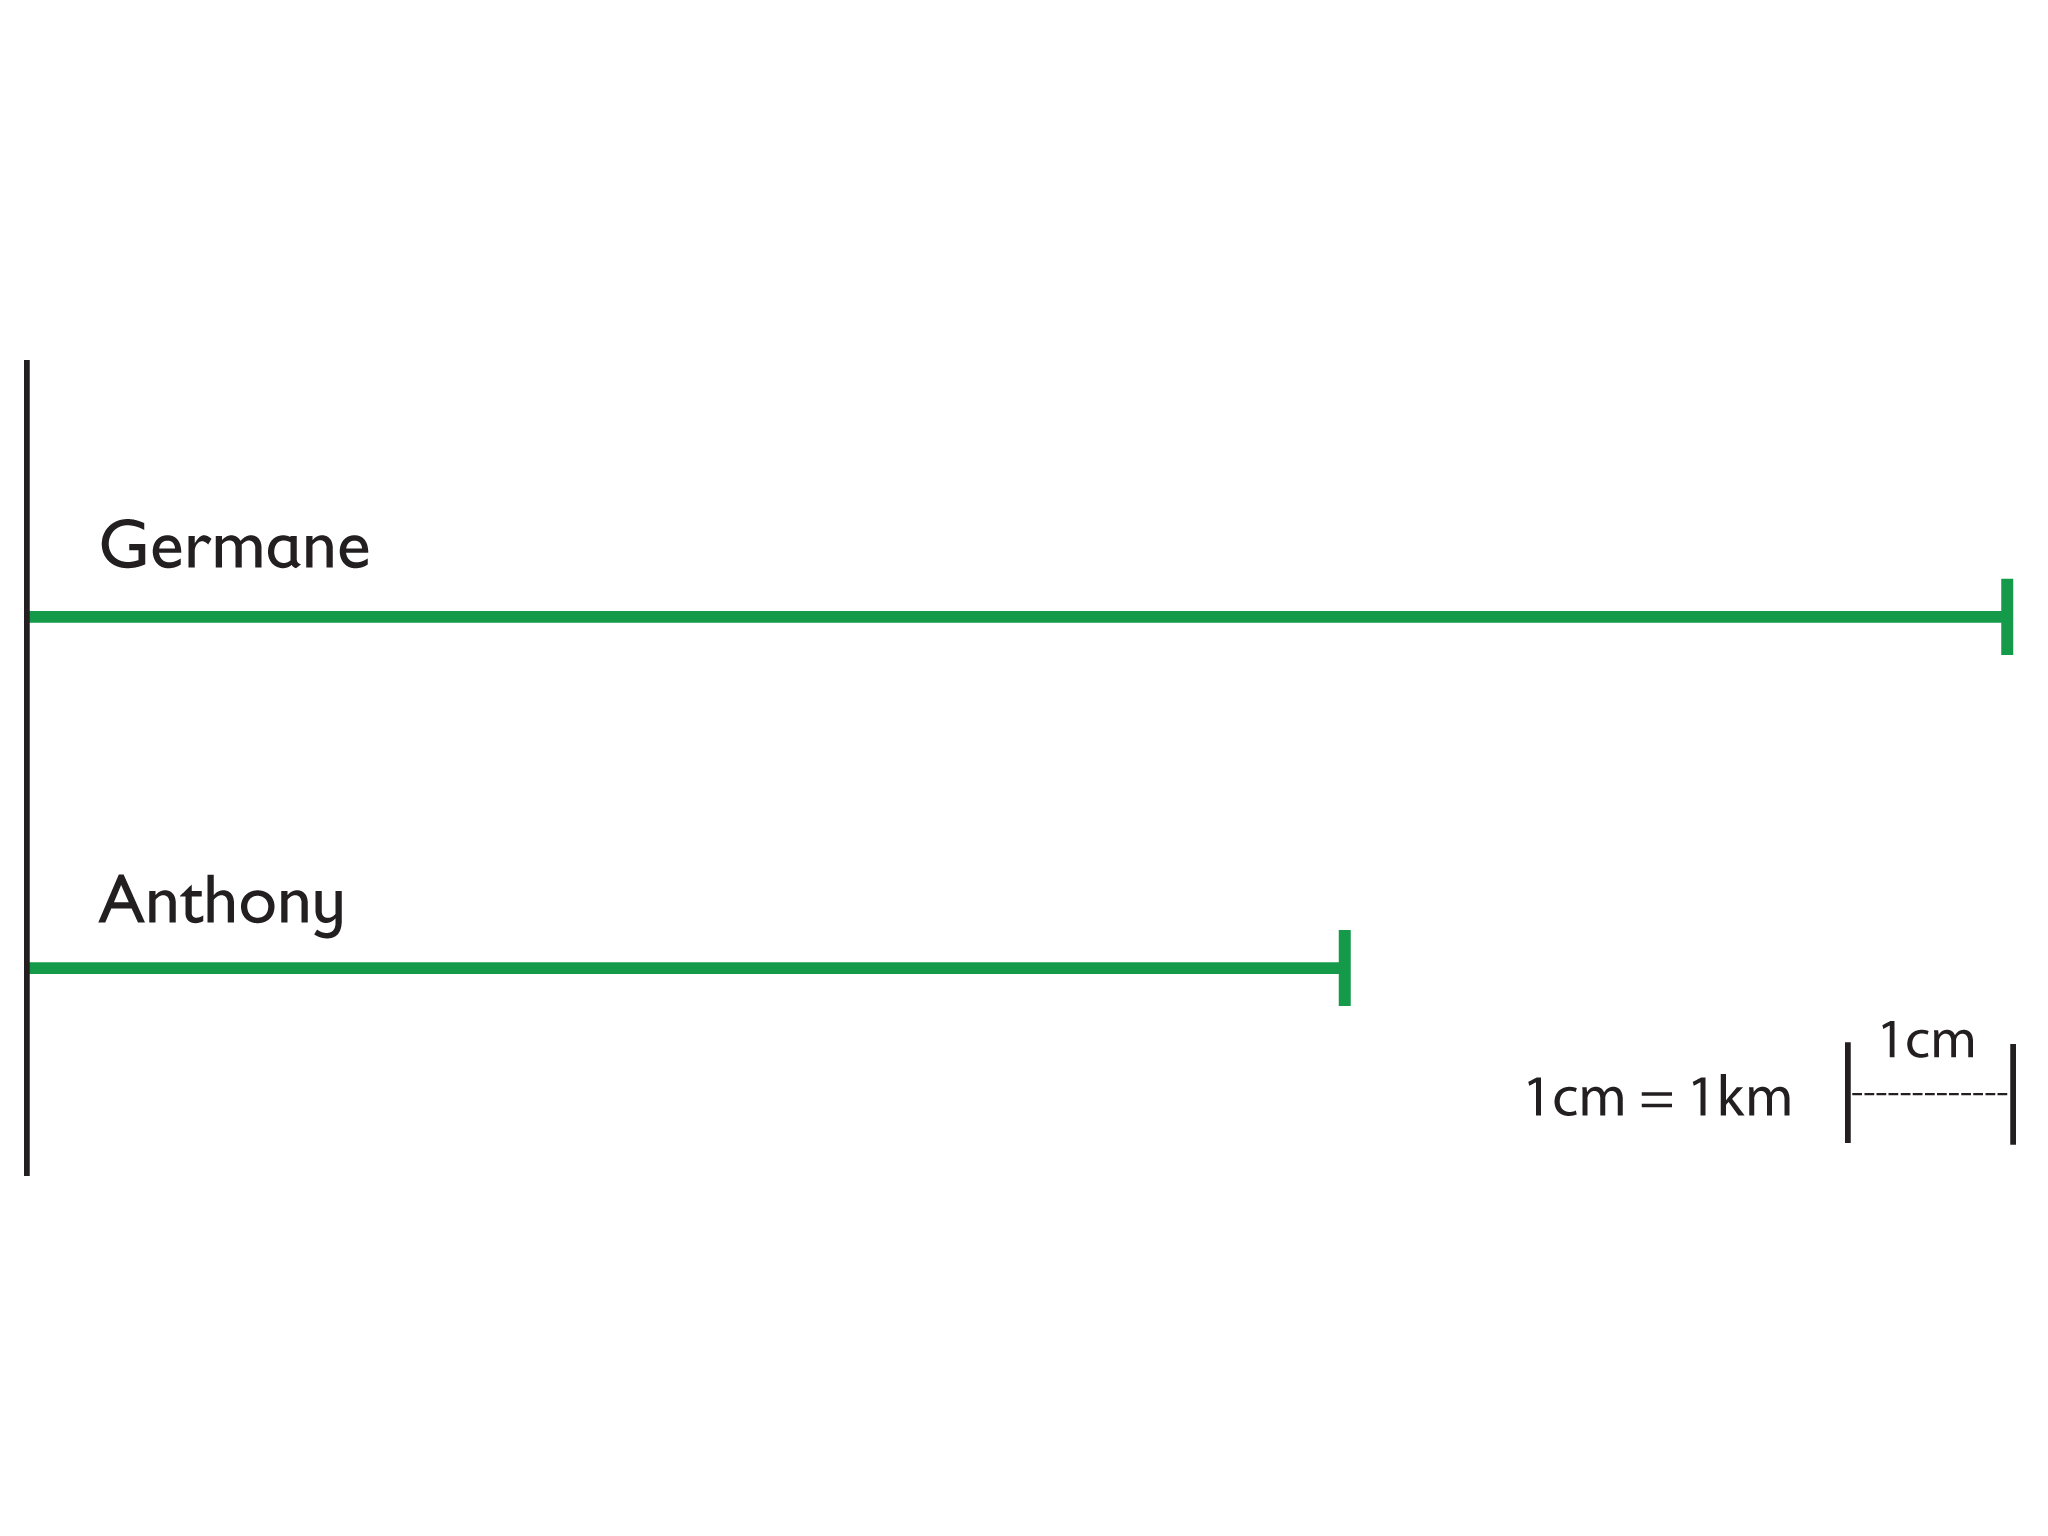
- Make a second scale drawing. This time, make your lines show how far each boy has walked after 2 hours. Again, use the scale 1 cm represents 1 km.
- Imagine that the two boys continue walking at the same speeds. The longer the two boys walk, the farther ahead Germane gets. But no matter how long the two boys walk, Germane’s distance will never be twice Anthony’s distance. Explain why.