A collection of resources that teach about the scientific aspects of climate change, including both life and earth sciences. Image credit United Nations
This video describes the joint NASA-JAXA GPM (Global Precipitation Measurement) satellite mission …
This video describes the joint NASA-JAXA GPM (Global Precipitation Measurement) satellite mission and why it is necessary for monitoring precipitation around the Earth. It discusses the science around the hazards of extreme precipitation such as landslides and drought. It emphasizes the value of comprehensive datasets and their ability to help predict natural disasters.
This video shows some of the most dramatic fluctuations to our cryosphere …
This video shows some of the most dramatic fluctuations to our cryosphere in recent years, using visuals created with a variety of satellite-based data.
Using real data from NASA's GRACE satellites, students will track water mass …
Using real data from NASA's GRACE satellites, students will track water mass changes in the U.S., data that measures changes in ice, surface and especially groundwater. The background information includes an animated video about where water exists and how it moves around Earth, as well as short video clips to introduce the GRACE mission and explain how satellites collect data. Students will estimate water resources using heat-map data, create a line graph for a specific location, then assess trends and discuss implications.
This activity illustrates the importance of water resources and how changes in climate are closely linked to changes in water resources. The activity could fit into many parts of a science curriculum, for example a unit on water could be connected to climate change.
In this lesson, students collect outdoor observational data to create a song …
In this lesson, students collect outdoor observational data to create a song about climate change. Intermediate music students will not only earn a greater appreciation for Alaska, but also for nature. These activities help students to learn how to use sound and sight maps in order to identify aspects of our region in Southeast Alaska. In addition, students learn about the basic concepts of climate change in order to write creative lyrics for songs for the entire school. At the end of the unit, students perform their unique songs in a school wide assembly.
Although written for Alaska, the lesson could easily be adapted for many other locations.
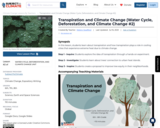
In this lesson, students learn about transpiration and how transpiration plays a …
In this lesson, students learn about transpiration and how transpiration plays a role in cooling cities that experience extreme heat due to climate change.
Step 1 - Inquire: Students explore the idea of transpiration through a hands-on experiment.
Step 2 - Investigate: Students learn about trees' connection to urban heat island.
Step 3 - Inspire: Students create a proposal to improve tree equity in their neighborhoods.
This video describes the role that dendrochronology plays in understanding climate change, …
This video describes the role that dendrochronology plays in understanding climate change, especially changes to high elevation environments at an upper tree line. Dendrochronologists from the Big Sky Institute sample living and dead trees, describe how correlations between trees are made, and explain how tree cores record climate changes.
Students analyze complex real-world problems by specifying qualitative and quantitative criteria and …
Students analyze complex real-world problems by specifying qualitative and quantitative criteria and constraints for solutions that account for societal needs and wants. This place-based activity discusses multiple strategies to reduce carbon emissions, and realistic paths to preventing climate change.
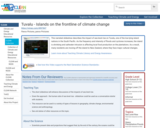
This narrated slideshow describes the impact of sea level rise on Tuvalu, …
This narrated slideshow describes the impact of sea level rise on Tuvalu, one of the low-lying island nations in the South Pacific. As the frequency and intensity of floods and cyclones increases, the island is shrinking and saltwater intrusion is affecting local food production on the plantations. As a result, many residents are moving off the island to New Zealand, where they face major cultural changes.
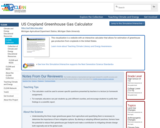
This visualization is a website with an interactive calculator that allows for …
This visualization is a website with an interactive calculator that allows for estimation of greenhouse gas production from croplands in the United States.
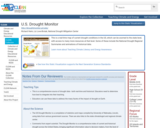
This is a real-time map of current drought conditions in the US, …
This is a real-time map of current drought conditions in the US, which can be zoomed to the state level, with access to many more resources at that level. Some of these include the National Drought Regional Summaries and animations of historical data.
EPA has many data sources available, these cover topics including but not …
EPA has many data sources available, these cover topics including but not limited to air, climate change, health risks, pollutants and contaminants, waste, and water. The data are downloadable and available through the Environmental Dataset Gateway (EDG). The EDG is a source of Web-based geospatial information and information services. It enables data consumers to discover, view, and access geospatial resources made available by EPA's program offices, regions, and labs.
This interactive module allows students and educators to build models that explain …
This interactive module allows students and educators to build models that explain how the Earth system works. The Click and Learn application can be used to show how Earth is affected by human activities and natural phenomena.
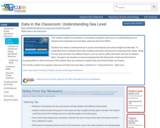
This module contains five activities, in increasing complexity, that focus on understanding …
This module contains five activities, in increasing complexity, that focus on understanding how to interpret and manipulate sea level data, using real data from NOAA. Students first need to understand how to access and interpret sea surface height and tide data. To understand how to interpret these data, students will review and practice computing mean values. Along the way, they will learn how different factors, such as storms, affect tide levels and how to measure them. The goal is for students to become experienced with these kinds of data and the tools for accessing them so that, by the end of the module, they can continue to explore data sets driven by their own inquiry.
This lesson plan has students working in small groups to research the …
This lesson plan has students working in small groups to research the Mountain Pine Beetle in Colorado and other inter-mountain Western states. Students identify the factors that control pine beetle population and research how warmer winters and decreasing spring snowpack allow the population of pine beetles to expand.
In this video segment adapted from the International Institute for Sustainable Development, …
In this video segment adapted from the International Institute for Sustainable Development, Inuit observers describe how their traditional understanding of weather patterns is being challenged by unpredictable weather behaviors.
In this activity, students examine a pair of satellite images of the …
In this activity, students examine a pair of satellite images of the ocean and determine whether there is a relationship between the height of ocean waves and the sea level. Data from the two images are plotted side by side and students discuss the reasons for their findings. The resource includes the images and a student worksheet. Summary background information, data and images supporting the activity are available on the Earth Update data site. To complete the activity, students will need to access the Space Update multimedia collection, which is available for download and purchase for use in the classroom.
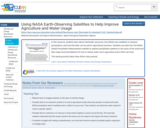
In this resource, students learn about freshwater resources, how NASA uses satellites …
In this resource, students learn about freshwater resources, how NASA uses satellites to measure precipitation, and how that data can be used in agricultural practices. Students use data from the NASA Global Precipitation Measurement satellite to explore precipitation patterns in two parts of the world and then make recommendations for how to reduce water use in agriculture and in their own lives.
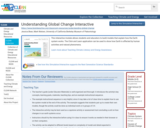
This is a teaching activity in which students learn about the connection …
This is a teaching activity in which students learn about the connection between CO2 emissions, CO2 concentration, and average global temperatures. Through a simple online model, students learn about the relationship between these and learn about climate modeling while predicting temperature change over the 21st century.
This video features interviews with native people living on atoll islands in …
This video features interviews with native people living on atoll islands in Micronesia, so viewers are able to understand the real, current threats that these people are facing due to climate change.
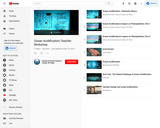
This YouTube playlist contains the video recordings of the lectures presented by …
This YouTube playlist contains the video recordings of the lectures presented by scientists at the Ocean Acidification workshop on July 11th, 2012. Playlist also contains a variety of other related videos that can be used as teaching tools and/or resources.
No restrictions on your remixing, redistributing, or making derivative works. Give credit to the author, as required.
Your remixing, redistributing, or making derivatives works comes with some restrictions, including how it is shared.
Your redistributing comes with some restrictions. Do not remix or make derivative works.
Most restrictive license type. Prohibits most uses, sharing, and any changes.
Copyrighted materials, available under Fair Use and the TEACH Act for US-based educators, or other custom arrangements. Go to the resource provider to see their individual restrictions.