Module 2 explores two-dimensional and three-dimensional shapes. Students learn about flat and …
Module 2 explores two-dimensional and three-dimensional shapes. Students learn about flat and solid shapes independently as well as how they are related to each other and to shapes in their environment. Students begin to use position words when referring to and moving shapes. Students learn to use their words to distinguish between examples and non-examples of flat and solid shapes.
Find the rest of the EngageNY Mathematics resources at https://archive.org/details/engageny-mathematics.
After students observed, analyzed, and classified objects by shape into pre-determined categories …
After students observed, analyzed, and classified objects by shape into pre-determined categories in Module 2, they now compare and analyze length, weight, volume, and, finally, number in Module 3. The module supports students understanding of amounts and their developing number sense. The module culminates in a three-day exploration, one day devoted to each attribute: length, weight, and volume.
Find the rest of the EngageNY Mathematics resources at https://archive.org/details/engageny-mathematics.
Module 4 marks the next exciting step in math for kindergartners, addition …
Module 4 marks the next exciting step in math for kindergartners, addition and subtraction! They begin to harness their practiced counting abilities, knowledge of the value of numbers, and work with embedded numbers to reason about and solve addition and subtraction expressions and equations. In Topics A and B, decomposition and composition are taught simultaneously using the number bond model so that students begin to understand the relationship between parts and wholes before moving into formal work with addition and subtraction in the rest of the module.
Find the rest of the EngageNY Mathematics resources at https://archive.org/details/engageny-mathematics.
Kindergarten comes to a close with another opportunity for students to explore …
Kindergarten comes to a close with another opportunity for students to explore geometry in Module 6. Throughout the year, students have built an intuitive understanding of two- and three-dimensional figures by examining exemplars, variants, and non-examples. They have used geometry as a context for exploring numerals as well as comparing attributes and quantities. To wrap up the year, students further develop their spatial reasoning skills and begin laying the groundwork for an understanding of area through composition of geometric figures.
Find the rest of the EngageNY Mathematics resources at https://archive.org/details/engageny-mathematics.
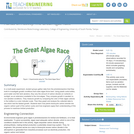
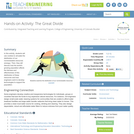
Students construct a model roadway with congestion and apply their knowledge of …
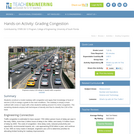
Students construct a model roadway with congestion and apply their knowledge of level of service (LOS) to assign a grade to the road conditions. The roadway is simply a track outlined with cones or ropes with a few students walking around it to mimic congestion. The remaining students employ both techniques of density and flow to classify the LOS of the track.
In this biology lab extension, student will have already collected leaves from …
In this biology lab extension, student will have already collected leaves from the playground and surrounding school areas and sorted them into categories according to leaf properties. Students will use the leave classifications/ sorts to graph the properties of the leaves.
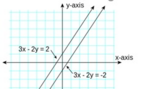
This seminar will allow you to solve a system of linear equations …
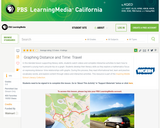
This seminar will allow you to solve a system of linear equations by graphing. It will help you to understand what it means when the lines in a system of equations are parallel, and also what it means for the graphs to be the same line. You will learn how to visually identify information about the system of equations simply by examining the graphs of the lines that make up the system.StandardsCC.2.2.HS.D.10Represent, solve, and interpret equations/inequalities and systems of equations/inequalities algebraically and graphically.
Students are introduced to different ways of displaying visual spectra, including colored …
Students are introduced to different ways of displaying visual spectra, including colored "barcode" spectra, like those produced by a diffraction grating, and line plots displaying intensity versus color, or wavelength. Students learn that a diffraction grating acts like a prism, bending light into its component colors.
Students simulate disease transmission by collecting data based on their proximity to …
Students simulate disease transmission by collecting data based on their proximity to other students. One option for measuring proximity is by having Bluetooth devices "discover" each other. After data is collected, students apply graph theory to analyze it, and summarize their data and findings in lab report format. Students learn real-world engineering applications of graph theory and see how numerous instances of real-world relationships can be more thoroughly understood by applying graph theory. Also, by applying graph theory the students are able to come up with possible solutions to limit the spread of disease. The activity is intended to be part of a computer science curriculum and knowledge of the Java programming language is required. To complete the activity, a computer with Java installed and appropriate editing software is needed.
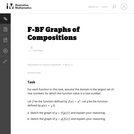
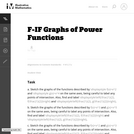
This task addresses an important issue about inverse functions. In this case …
This task addresses an important issue about inverse functions. In this case the function f is the inverse of the function g but g is not the inverse of f unless the domain of f is restricted.
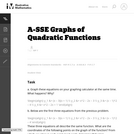
This task requires students to recognize the graphs of different (positive) powers …
This task requires students to recognize the graphs of different (positive) powers of x. There are several important aspects to these graphs. First, the graphs of even powers of x all open upward as x grows in the positive or negative direction. The larger the even power, the flatter these graphs look near 0 and the more rapidly they increase once the distance of x from 0 excedes 1.
This exploration can be done in class near the beginning of a …
This exploration can be done in class near the beginning of a unit on graphing parabolas. Students need to be familiar with intercepts, and need to know what the vertex is.
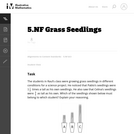
In a multi-week experiment, student groups gather data from the photobioreactors that …
In a multi-week experiment, student groups gather data from the photobioreactors that they build to investigate growth conditions that make algae thrive best. Using plastic soda bottles, pond water and fish tank aerators, they vary the amount of carbon dioxide (or nutrients or sunlight, as an extension) available to the microalgae. They compare growth in aerated vs. non-aerated conditions. They measure growth by comparing the color of their algae cultures in the bottles to a color indicator scale. Then they graph and analyze the collected data to see which had the fastest growth. Students learn how plants biorecycle carbon dioxide into organic carbon (part of the carbon cycle) and how engineers apply their understanding of this process to maximize biofuel production.
In this activity, students will use cookies to simulate the distribution of …
In this activity, students will use cookies to simulate the distribution of our nonrenewable resources (energy). Then, they will discuss how the world's growing population affects the fairness and effectiveness of this distribution of these resources and how engineers work to develop technologies to support the population.
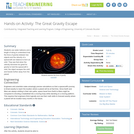
Students use water balloons and a length of string to understand how …
Students use water balloons and a length of string to understand how the force of gravity between two objects and the velocity of a spacecraft can balance to form an orbit. They see that when the velocity becomes too great for gravity to hold the spacecraft in orbit, the object escapes the orbit and travels further away from the planet.
Students will be practicing and review the concepts of greatest common factor. …
Students will be practicing and review the concepts of greatest common factor. This is a great tool to use before a test or to give the students extra practice.
No restrictions on your remixing, redistributing, or making derivative works. Give credit to the author, as required.
Your remixing, redistributing, or making derivatives works comes with some restrictions, including how it is shared.
Your redistributing comes with some restrictions. Do not remix or make derivative works.
Most restrictive license type. Prohibits most uses, sharing, and any changes.
Copyrighted materials, available under Fair Use and the TEACH Act for US-based educators, or other custom arrangements. Go to the resource provider to see their individual restrictions.