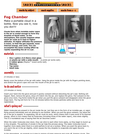
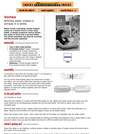
In this weather-related activity, learners make a portable cloud in a bottle. …
In this weather-related activity, learners make a portable cloud in a bottle. Learners discover that clouds form when invisible water vapor in the air is cooled enough to form tiny droplets of liquid water. You an accomplish the same cooling effect by rapidly expanding air in a jar using a wide-mouth jar, rubber glove, matches, and tap water. This activity can be conducted as a demonstration or by learners with adult supervision.
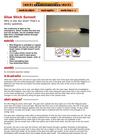
In this activity, learners explore why the sky is blue. Learners model …
In this activity, learners explore why the sky is blue. Learners model the scattering of light by the atmosphere, which creates the blue sky and red sunset, using a flashlight and clear glue sticks. This resource guide includes an explanation of how light scatters and how this scattering can cause the polarization of light.
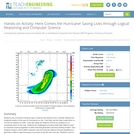
Students use a hurricane tracking map to measure the distance from a …
Students use a hurricane tracking map to measure the distance from a specific latitude and longitude location of the eye of a hurricane to a city. Then they use the map's scale factor to convert the distance to miles. They also apply the distance formula by creating an x-y coordinate plane on the map. Students are challenged to analyze what data might be used by computer science engineers to write code that generates hurricane tracking models. Then students analyze a MATLAB® computer code that uses the distance formula repetitively to generate a table of data that tracks a hurricane at specific time intervals. Students come to realize that using a computer program to generate the calculations (instead of by hand) is very advantageous for a dynamic situation like tracking storm movements. Their inspection of some MATLAB code helps them understand how it communicates what to do using mathematical formulas, logical instructions and repeated tasks. They also conclude that the example program is too simplistic to really be a useful tool; useful computer model tools must necessarily be much more complex.
The earth’s atmosphere may seem thick when compared to something like your …
The earth’s atmosphere may seem thick when compared to something like your height—but it’s surprisingly thin when compared to the earth’s radius. Here, you can find out exactly how thin, using strips of plastic to model the correctly scaled thickness of the atmosphere on a globe.
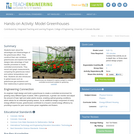
Students learn about the advantages and disadvantages of the greenhouse effect. They …
Students learn about the advantages and disadvantages of the greenhouse effect. They construct their own miniature greenhouses and explore how their designs take advantage of heat transfer processes to create controlled environments. They record and graph measurements, comparing the greenhouse indoor and outdoor temperatures over time. Students are also introduced to global issues such as greenhouse gas emissions and their relationship to global warming.
In this activity, students observe fluid motion and the formation of convection …
In this activity, students observe fluid motion and the formation of convection cells as a solution of soap and water is heated. This procedure can be performed as a demonstration by the teacher, or older students can conduct the experiment themselves. A list of materials, instructions, and a description of the convective process are included.
In this group activity, learners use some common objects and work together …
In this group activity, learners use some common objects and work together to simulate the Coriolis effect. During the challenge, learners make predictions and test different scenarios. This resource includes background information about the Coriolis effect and helpful hints.
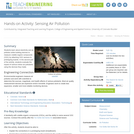
Students learn about electricity and air pollution while building devices to measure …
Students learn about electricity and air pollution while building devices to measure volatile organic compounds (VOC) by attaching VOC sensors to prototyping boards. In the second part of the activity, students evaluate the impact of various indoor air pollutants using the devices they made.
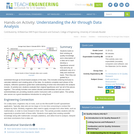
Students build on their existing air quality knowledge and a description of …
Students build on their existing air quality knowledge and a description of a data set to each develop a hypothesis around how and why air pollutants vary on a daily and seasonal basis. Then they are guided by a worksheet through an Excel-based analysis of the data. This includes entering formulas to calculate statistics and creating plots of the data. As students complete each phase of the analysis, reflection questions guide their understanding of what new information the analysis reveals. At activity end, students evaluate their original hypotheses and “put all of the pieces together.” The activity includes one carbon dioxide worksheet/data set and one ozone worksheet/data set; providing students and/or instructors with a content option. The activity also serves as a good standalone introduction to using Excel.
In this activity, learners create a tornado in a bottle to observe …
In this activity, learners create a tornado in a bottle to observe a spiraling, funnel-shaped vortex. A simple connector device allows water to drain from a 2-liter bottle into a second bottle. Learners can observe the whirling water and then repeat the process by inverting the bottle. Use this activity to talk about surface tension, pressure, gravity, friction, angular momentum, and centripetal force.
No restrictions on your remixing, redistributing, or making derivative works. Give credit to the author, as required.
Your remixing, redistributing, or making derivatives works comes with some restrictions, including how it is shared.
Your redistributing comes with some restrictions. Do not remix or make derivative works.
Most restrictive license type. Prohibits most uses, sharing, and any changes.
Copyrighted materials, available under Fair Use and the TEACH Act for US-based educators, or other custom arrangements. Go to the resource provider to see their individual restrictions.