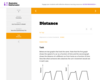
All resources in Oregon Mathematics

Bike Race

(View Complete Item Description)

The purpose of this task is for students to interpret two distance-time graphs in terms of the context of a bicycle race. There are two major mathematical aspects to this: interpreting what a particular point on the graph means in terms of the context, and understanding that the "steepness" of the graph tells us something about how fast the bicyclists are moving.

Material Type: Activity/Lab

Author: Illustrative Mathematics

Riding by the Library

(View Complete Item Description)

In this task students draw the graphs of two functions from verbal descriptions. Both functions describe the same situation but changing the viewpoint of the observer changes where the function has output value zero. This small twist forces the students to think carefully about the interpretation of the dependent variable.

Material Type: Activity/Lab

Author: Illustrative Mathematics

Distance

(View Complete Item Description)

In this task students interpret two graphs that look the same but show very different quantities. The first graph gives information about how fast a car is moving while the second graph gives information about the position of the car. This problem works well to generate a class or small group discussion. Students learn that graphs tell stories and have to be interpreted by carefully thinking about the quantities shown.

Material Type: Activity/Lab

Author: Illustrative Mathematics

8.SP Laptop Battery Charge

(View Complete Item Description)

This is a task from the Illustrative Mathematics website that is one part of a complete illustration of the standard to which it is aligned. Each task has at least one solution and some commentary that addresses important asects of the task and its potential use. Here are the first few lines of the commentary for this task: Jerry forgot to plug in his laptop before he went to bed. He wants to take the laptop to his friend's house with a full battery. The pictures below sho...

Material Type: Activity/Lab

Author: Illustrative Mathematics

8.SP Animal Brains

(View Complete Item Description)

This is a task from the Illustrative Mathematics website that is one part of a complete illustration of the standard to which it is aligned. Each task has at least one solution and some commentary that addresses important asects of the task and its potential use. Here are the first few lines of the commentary for this task: Is there an association between the weight of an animal’s body and the weight of the animal’s brain? 1. Make a scatterplot using the following data. Bo...

Material Type: Activity/Lab

Author: Illustrative Mathematics

8.SP US Airports, Assessment Variation

(View Complete Item Description)

This is a task from the Illustrative Mathematics website that is one part of a complete illustration of the standard to which it is aligned. Each task has at least one solution and some commentary that addresses important asects of the task and its potential use. Here are the first few lines of the commentary for this task: The scatter plot below shows the relationship between the number of airports in a state and the population of that state according to the 2010 Census. ...

Material Type: Activity/Lab

Author: Illustrative Mathematics

8.G Point Reflection

(View Complete Item Description)

This is a task from the Illustrative Mathematics website that is one part of a complete illustration of the standard to which it is aligned. Each task has at least one solution and some commentary that addresses important asects of the task and its potential use. Here are the first few lines of the commentary for this task: The point in the $x$-$y$ plane with coordinates $(1000,2012)$ is reflected across the line $y=2000$. What are the coordinates of the reflected point?...

Material Type: Activity/Lab

Author: Illustrative Mathematics

Effects of Dilations on Length, Area, and Angles

(View Complete Item Description)

The purpose of this task is for students to study the impact of dilations on different measurements: segment lengths, area, and angle measure. When a triangle is dilated by scale factor s>0, the base and height change by the scale factor s while the area changes by a factor of s2: as seen in the examples presented here, this is true regardless of the center of dilation.

Material Type: Activity/Lab

Author: Illustrative Mathematics

Are They Similar?

(View Complete Item Description)

In this problem, students are given a picture of two triangles that appear to be similar, but whose similarity cannot be proven without further information. Asking students to provide a sequence of similarity transformations that maps one triangle to the other focuses them on the work of standard G-SRT.2, using the definition of similarity in terms of similarity transformations.

Material Type: Activity/Lab

Author: Illustrative Mathematics

Creating Similar Triangles

(View Complete Item Description)

The purpose of this task is to apply rigid motions and dilations to show that triangles are similar. The teacher will need to monitor students carefully to make sure that they draw an appropriate line segment: for this particular triangle, the only one which will work is the segment from B (the vertex of the right angle) perpendicular to AC.

Material Type: Activity/Lab

Author: Illustrative Mathematics

Find the Missing Angle

(View Complete Item Description)

This task "Uses facts about supplementary, complementary, vertical, and adjacent angles in a multi-step problem to write and solve simple equations for an unknown angle in a figure (7.G.5)" except that it requires students to know, in addition, something about parallel lines, which students will not see until 8th grade.

Material Type: Activity/Lab

Author: Illustrative Mathematics

8.G A Triangle's Interior Angles

(View Complete Item Description)

This is a task from the Illustrative Mathematics website that is one part of a complete illustration of the standard to which it is aligned. Each task has at least one solution and some commentary that addresses important asects of the task and its potential use. Here are the first few lines of the commentary for this task: Given that $\overleftrightarrow{DE}\parallel\overleftrightarrow{AC}$ in the diagram below, prove that $a + b + c = 180.$ Explain why this result holds ...

Material Type: Activity/Lab

Author: Illustrative Mathematics