This is one component of the Seismogenic zone Experiment Mini Lessons
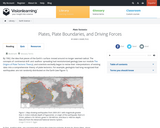
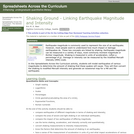
This mini lesson provides an example of how stratigraphy influences tectonics, and vice versa. The magnitude 9 Tohoku earthquake slipped a record 50m along a plate boundary fault comprised of extraordinarily weak smectite-rich pelagic clay [Chester et al., 2013; Ujiie et al., 2013, Fulton et al., 2013]. This clay may also have served as a slip surface for numerous large tsunami and tsunamigenic earthquakes along the subduction zone to the northeast, but it facilitated none along the Japan and Izu-Bonin Trenches to the south. During this lesson students will discover the probable reasons for this dichotomy.
Students will be supplied with locations of the Tohoku earthquake ocean drilling site (C0019) and the reference Site (436) as they are back tracked through Pacific Plate motions to their locations of origin. Students will construct the vertical sedimentary sequence that would occur, using Walther's Law (Prothero and Schwab, 1996, p. 329-330).
The student-reconstructed vertical sequence of sedimentary deposits will be compared to that at IODP Site 436. Site 436 includes a conspicuous interval of pelagic clay and is the oceanic reference site for Site C0019 drilled during Exp. 343. Students will compare the vertical succession of sediment lithologies hypothetically accumulated in their backtracked site to those observed at Sites 436, C0019 and others on the oceanic plate incoming to the subduction zone. Students will learn that smooth seafloor correlates with continuity of the pelagic clay layer, whereas, areas of rough seafloor (containing seamounts capped with carbonate and siliceous pelagic sediments) correlate with discontinuity of the pelagic clay layer. They will also learn that large earthquakes and tsunamis occur only in areas of more continuous incoming pelagic clay. Students will be able to speculate on the role of seamounts in interruption of the propagation of seismic slip (e.g. Wang and Bilek, 2011, 2014).
- Subject:
- Geology
- Physical Geography
- Physical Science
- Material Type:
- Activity/Lab
- Provider:
- Science Education Resource Center (SERC) at Carleton College
- Provider Set:
- Teach the Earth
- Author:
- (James) Casey Moore
- Date Added:
- 01/20/2023