Updating search results...

Search Resources

402 Results

View
Selected filters:
  • quantitative-reasoning
Global Phosphorus Cycle
Conditional Remix & Share Permitted
CC BY-NC-SA
Rating
0.0 stars

Students create and modify a STELLA model of the global phosphorus cycle to test a number of scenarios.

(Note: this resource was added to OER Commons as part of a batch upload of over 2,200 records. If you notice an issue with the quality of the metadata, please let us know by using the 'report' button and we will flag it for consideration.)

Subject:
Biology
Chemistry
Geoscience
Life Science
Mathematics
Measurement and Data
Physical Science
Statistics and Probability
Material Type:
Activity/Lab
Interactive
Provider:
Science Education Resource Center (SERC) at Carleton College
Provider Set:
Teach the Earth
Author:
Kirsten Menking
Date Added:
09/15/2020
Global Warming: A Zonal Energy Balance Model
Conditional Remix & Share Permitted
CC BY-NC-SA
Rating
0.0 stars

This is a teaching module, directed to undergraduate students in applied mathematics, that presents a Zonal Energy Balance Model to describe the evolution of the latitudinal distribution of Earth's surface temperature subject to incremental levels of cumulative carbon emissions in the atmosphere. A strategy to avert "dangerous levels" of global warming is imbedded in the model. Students working with the module will write a computer code, using a software such as MATLAB or Mathematica, to obtain numerical solutions of the model and simulate strategies that guarantee controlled levels of global warming.

Subject:
Geology
Mathematics
Measurement and Data
Physical Science
Statistics and Probability
Material Type:
Homework/Assignment
Provider:
Science Education Resource Center (SERC) at Carleton College
Provider Set:
Teach the Earth
Author:
Victor Padron
Date Added:
01/20/2023
Graphically Presenting Quantitative Relationships: Elements of Effective Posters
Conditional Remix & Share Permitted
CC BY-NC-SA
Rating
0.0 stars

This workshop involves students in evaluating the efficacy of posters as a communication tool, focusing on elements of clarity in poster and graphic design.

Subject:
Political Science
Social Science
Material Type:
Activity/Lab
Provider:
Science Education Resource Center (SERC) at Carleton College
Provider Set:
Pedagogy in Action
Author:
Julian Westerhout
Date Added:
11/06/2014
Green Infrastructure/Green Roofs
Conditional Remix & Share Permitted
CC BY-NC-SA
Rating
0.0 stars

Runoff in urban areas is an increasingly important issue when it comes to water quality. It is a major hydrologic issue in New York City, as urban infrastructure creates excess runoff and impervious surfaces decrease the infiltration rate of land surfaces. This excess runoff, which often times carries with it pollutants and contaminants, has proven to create water quality issues. It has become ever more critical to try to mitigate the influx of runoff into our waterways. Urbanization increases runoff, and in NYC 64% of the area is impervious.
In this module students will explore green roofs as a potential solution to the environmental impacts of increased precipitation brought on by climate change. They will evaluate data collected from studies on 15 green roofs from different areas of the US and other countries, as well as historical precipitation data from Central Park in NY to illustrate how precipitation patterns are changing and if we need to use green infrastructure, such as green roofs, to combat the symptoms of climate change. Students will also use Model My Watershed , a watershed-modeling web app, to analyze real land use data, model storm-water runoff and water-quality impacts using professional-grade models, and compare how different conservation or development scenarios could modify runoff and water quality.

(Note: this resource was added to OER Commons as part of a batch upload of over 2,200 records. If you notice an issue with the quality of the metadata, please let us know by using the 'report' button and we will flag it for consideration.)

Subject:
Biology
Career and Technical Education
Environmental Studies
Geology
Life Science
Mathematics
Measurement and Data
Physical Science
Statistics and Probability
Material Type:
Activity/Lab
Provider:
Science Education Resource Center (SERC) at Carleton College
Provider Set:
Teach the Earth
Author:
Elizabeth Farrell, CUNY Queens College; SUNY Nassau Community College
Date Added:
09/19/2022
Grocery Store Survey of Aquaculture Products
Conditional Remix & Share Permitted
CC BY-NC-SA
Rating
0.0 stars

Students work in pairs to survey seafood items sold in local grocery stores or fish markets, recording whether items are farm-raised or wild caught, fresh, frozen or preserved, as well as country of origin. Students use the Seafood Watch website to research the status of each seafood item (e.g., best choice, good choice or avoid). Class data is compiled in an online or Excel spreadsheet. Students use class data to create bar graphs and pie charts of the data for the different categories. Students turn in individual analyses and answer questions based on class results.

(Note: this resource was added to OER Commons as part of a batch upload of over 2,200 records. If you notice an issue with the quality of the metadata, please let us know by using the 'report' button and we will flag it for consideration.)

Subject:
Biology
Career and Technical Education
Environmental Studies
Life Science
Mathematics
Measurement and Data
Oceanography
Physical Science
Statistics and Probability
Material Type:
Activity/Lab
Provider:
Science Education Resource Center (SERC) at Carleton College
Provider Set:
Teach the Earth
Author:
Susan Richardson
Date Added:
09/03/2020
Groundwater in Tampa FL on the Sulphur Springs Quadrangle
Conditional Remix & Share Permitted
CC BY-NC-SA
Rating
0.0 stars

Groundwater accounts for only 0.75% of all water on Earth, yet it is a precious resource for the biosphere. In the United States, about one-fifth of the population taps into the groundwater reservoir of the hydrologic cycle as their main source of drinking water. However, worldwide, about 40% of all irrigation water comes from groundwater, and up to 80% of groundwater withdrawals are used for agriculture. Groundwater is also at risk and vulnerable to pollution, especially in areas with karst topography such as Tampa FL. Thus, the more people who understand the potential and the problems associated with groundwater, the better are the prospects for this resource.

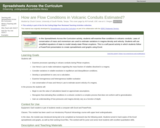
Student materials for this exercise include a Microsoft Excel spreadsheet with with data for dye tests and elevations, a .zip archive with two versions of the topographic map (PDF and JPG), as well as the instruction sheet. The exercise is divided into three parts.

In Part I, students study the Sulphur Springs topographic quadrangle and identify features of karst topography on the map. This part of the exercise also reviews basic groundwater terminology.

Part II involves transferring hydraulic head information from Microsoft Excel to a simplified sketch map of the quadrange and drawing contour lines on the potentiometric surface. Next, students use the contour lines to add arrows indicating the direction of groundwater flow. Finally, students apply their knowledge to determine which lakes could be affected by a toxic spill within the quadrangle.

In Part III, students study the results of dye tests in the Sulphur Springs quadrangle to analyze the flow of groundwater. They also use elevation data to construct a vertical cross section that illustrates the ground surface, the water table, and the potentiometric surface for the Floridan aquifer, and they relate the cross section to features on the topographic map.

(Note: this resource was added to OER Commons as part of a batch upload of over 2,200 records. If you notice an issue with the quality of the metadata, please let us know by using the 'report' button and we will flag it for consideration.)

Subject:
Biology
Hydrology
Life Science
Mathematics
Measurement and Data
Physical Science
Statistics and Probability
Material Type:
Activity/Lab
Provider:
Science Education Resource Center (SERC) at Carleton College
Provider Set:
Teach the Earth
Author:
Eileen Herrstrom
Date Added:
03/30/2022
Gulf Anoxia Course Project
Conditional Remix & Share Permitted
CC BY-NC-SA
Rating
0.0 stars

In this activity students work in groups to investigate the problem of Gulf of Mexico hypoxia before developing mitigation strategies based on local contriubtions to the problem. The students present their ideas in a public meeting debate format from which a solution must be selected by the entire class.

(Note: this resource was added to OER Commons as part of a batch upload of over 2,200 records. If you notice an issue with the quality of the metadata, please let us know by using the 'report' button and we will flag it for consideration.)

Subject:
Biology
Chemistry
Geoscience
Life Science
Mathematics
Measurement and Data
Oceanography
Physical Science
Statistics and Probability
Material Type:
Activity/Lab
Homework/Assignment
Provider:
Science Education Resource Center (SERC) at Carleton College
Provider Set:
Teach the Earth
Author:
Sadredin Moosavi
Date Added:
08/11/2019
Heat Capacity of Minerals: A Hands-On Introduction to Chemical Thermodynamics
Conditional Remix & Share Permitted
CC BY-NC-SA
Rating
0.0 stars

Minerals are inorganic chemical compounds with a wide range of physical and chemical properties. Geologists frequently measure and observe properties such as hardness, specific gravity, color, etc. Unfortunately, students usually view these properties simply as tools for identifying unknown mineral specimens. One of the objectives of this exercise is to make students aware of the fact that minerals have many additional properties that can be measured, and that all of the physical and chemical properties of minerals have important applications beyond that of simple mineral identification.
Please do not let the title of this exercise scare you away. Introducing students to thermodynamics is not the primary objective. Getting students to "do" science - to observe, record, and interpret experimental data - is the primary goal. Heat capacity just happens to be a good vehicle for this purpose.

(Note: this resource was added to OER Commons as part of a batch upload of over 2,200 records. If you notice an issue with the quality of the metadata, please let us know by using the 'report' button and we will flag it for consideration.)

Subject:
Biology
Chemistry
Life Science
Mathematics
Measurement and Data
Physical Science
Physics
Statistics and Probability
Material Type:
Activity/Lab
Data Set
Homework/Assignment
Interactive
Provider:
Science Education Resource Center (SERC) at Carleton College
Provider Set:
Teach the Earth
Author:
David Bailey
Date Added:
09/09/2020
The Heat is On: Understanding Local Climate Change
Conditional Remix & Share Permitted
CC BY-NC-SA
Rating
0.0 stars

The is a curriculum module from the project Data Sets and Inquiry in Geoscience Education (DIGS). The module consists of a week-long unit and two-day performance assessment in which students apply the inquiry skills to problem-based investigations of urban micro-climates. The unit and performance assessment present semi-parallel tasks but about different cities (Phoenix and Chicago).

Sudents draw conclusions about the extent to which multiple decades of temperature data about Phoenix suggest that a shift in local climate is taking place as opposed to exhibiting nothing more than natural variability. The data are from the Global Climate Historical Network (GHCN) database. GHCN is a large, multi-year, international project to measure temperature, precipitation, and air pressure from near the ground. Each monthly maximum and minimum temperature is the highest and lowest temperature reading for the month, measured in Celsius. In Phoenix and in most other places, the temperature data are collected at local airports. The performance assessment for this module requires that students apply the methods and findings from the investigation of the climate data for Phoenix to climate data for Chicago. The Chicago data shows less evidence of trends in temperature change, and this is most evident comparing the night-time minimum temperature fluctuations between the two cities. Chicago also exhibits less increase in urban development and population growth than does Phoenix. In contrast to the curriculum unit, which primarily uses constructed-response tasks to encourage student explanation and discussion, the climate assessment tasks pose explicit selected- and constructed-response questions to ensure that the items elicit the intended thinking and hence provide evidence of the targeted standards-aligned skills and understandings.

(Note: this resource was added to OER Commons as part of a batch upload of over 2,200 records. If you notice an issue with the quality of the metadata, please let us know by using the 'report' button and we will flag it for consideration.)

Subject:
Applied Science
Biology
Environmental Science
History
Life Science
Mathematics
Measurement and Data
Statistics and Probability
Material Type:
Activity/Lab
Data Set
Lesson Plan
Provider:
Science Education Resource Center (SERC) at Carleton College
Provider Set:
Teach the Earth
Author:
Dan Zalles
Date Added:
12/01/2021
Homework on Stoke's Law and Magmatic Differentiation
Conditional Remix & Share Permitted
CC BY-NC-SA
Rating
0.0 stars

This homework has two parts. In the first part, the students use Stoke's Law to determine (a) the relative sizes of olivine and plagioclase settling at the same velocity (and relate their answer to observations made on cumulate rocks in the lab, (b) the length of time it would take a xenolith-bearing basalt on Hawaii to reach the surface, and (c) to realize that pumice landing on seawater will float, not sink! In part 2, the students fill out a worksheet to see the effects of simultaneous fractional crystallization of olivine, clinopyroxene, and plagioclase on residual melt composition, and then determine whether the melt follows a tholeiitic or calcalkaline trend. The homework involves simple algebra, but several unit conversions and normalization of the results. After the students hand in the homework, we have a class discussion on the assumptions and problems associated with using Stoke's Law to model magmatic processes. We also work with different colored marbles to see the effects of fractional removal of different "minerals" on residual magma composition. My main goal in assigning this homework is to have students see that they can use simple math to come up with results for themselves, and then to have them think about the significance of those results.

(Note: this resource was added to OER Commons as part of a batch upload of over 2,200 records. If you notice an issue with the quality of the metadata, please let us know by using the 'report' button and we will flag it for consideration.)

Subject:
Biology
Life Science
Mathematics
Measurement and Data
Statistics and Probability
Material Type:
Activity/Lab
Data Set
Lesson Plan
Provider:
Science Education Resource Center (SERC) at Carleton College
Provider Set:
Teach the Earth
Author:
Jane Selverstone
Date Added:
08/06/2019
How Big is Your Breakfast Footprint?
Conditional Remix & Share Permitted
CC BY-NC-SA
Rating
0.0 stars

Calculation of a carbon footprint resulting from common breakfast choices illustrates the importance of contextualization.

(Note: this resource was added to OER Commons as part of a batch upload of over 2,200 records. If you notice an issue with the quality of the metadata, please let us know by using the 'report' button and we will flag it for consideration.)

Subject:
Applied Science
Environmental Science
Material Type:
Activity/Lab
Provider:
Science Education Resource Center (SERC) at Carleton College
Provider Set:
Teach the Earth
Author:
Ben Galluzzo
Date Added:
04/24/2018
How Big is a Trillion?
Conditional Remix & Share Permitted
CC BY-NC-SA
Rating
0.0 stars

Perhaps the first skill needed for successful quantitative reasoning is the ability to understand a single number. Newspaper headlines over the last year have used some amazingly large figures when discussing the national debt, bailout funds, corporate bonuses, or economic stimulus packages. Millions, billions, and trillions of dollars are often encountered in such stories. The ability to process these large values and compare their relative values is essential in understanding the financial nuances to such articles. This example contains two in-depth approaches to understanding large quantities.

Subject:
Mathematics
Material Type:
Activity/Lab
Provider:
Science Education Resource Center (SERC) at Carleton College
Provider Set:
Starting Point (SERC)
Author:
Stuart Boersma
Date Added:
08/28/2012
How Do We Estimate Magma Viscosity?
Conditional Remix & Share Permitted
CC BY-NC-SA
Rating
0.0 stars

SSAC Physical Volcanology module. Students build a spreadsheet to examine how magma viscosity varies with temperature, fraction of crystals, and water content using the non-Arrhenian VFT model.

(Note: this resource was added to OER Commons as part of a batch upload of over 2,200 records. If you notice an issue with the quality of the metadata, please let us know by using the 'report' button and we will flag it for consideration.)

Subject:
Biology
Life Science
Mathematics
Measurement and Data
Physical Science
Physics
Statistics and Probability
Material Type:
Activity/Lab
Provider:
Science Education Resource Center (SERC) at Carleton College
Provider Set:
Teach the Earth
Author:
chuck connor
Date Added:
08/25/2020
How Do We Estimate Melt Density?
Conditional Remix & Share Permitted
CC BY-NC-SA
Rating
0.0 stars

SSAC Physical Volcanology module. Students build spreadsheets to estimate melt density at high temperatures and pressures from the thermodynamic properties of silicates.

(Note: this resource was added to OER Commons as part of a batch upload of over 2,200 records. If you notice an issue with the quality of the metadata, please let us know by using the 'report' button and we will flag it for consideration.)

Subject:
Biology
Life Science
Mathematics
Measurement and Data
Physical Science
Physics
Statistics and Probability
Material Type:
Activity/Lab
Provider:
Science Education Resource Center (SERC) at Carleton College
Provider Set:
Teach the Earth
Author:
chuck connor
Date Added:
05/07/2018
How Do We Know Where an Earthquake Originated?
Conditional Remix & Share Permitted
CC BY-NC-SA
Rating
0.0 stars

Students use real seismograms to determine the arrival times for P and S waves and use these times to determine the distance of the seismic station from the earthquake. Seismograms from three stations are provided to determine the epicenter using the S -- P (S minus P) method. Because real seismograms contain some "noise" with resultant uncertainty in locating arrival times of P and S waves, this activity promotes appreciation for uncertainties in interpretation of real scientific data.

(Note: this resource was added to OER Commons as part of a batch upload of over 2,200 records. If you notice an issue with the quality of the metadata, please let us know by using the 'report' button and we will flag it for consideration.)

Subject:
Biology
Life Science
Mathematics
Measurement and Data
Statistics and Probability
Material Type:
Activity/Lab
Provider:
Science Education Resource Center (SERC) at Carleton College
Provider Set:
Teach the Earth
Author:
Jeffrey Barker (Binghamton University) & Michael Hubenthal (IRIS)
Date Added:
09/26/2022
How Does Surface Deformation at an Active Volcano Relate to Pressure and Volume Change in the Magma Chamber?
Conditional Remix & Share Permitted
CC BY-NC-SA
Rating
0.0 stars

SSAC Physical Volcanology module. Students build a spreadsheet to examine and apply the Mogi model for horizontal and vertical surface displacement vs. depth and pressure conditions in the magma chamber.

(Note: this resource was added to OER Commons as part of a batch upload of over 2,200 records. If you notice an issue with the quality of the metadata, please let us know by using the 'report' button and we will flag it for consideration.)

Subject:
Biology
Life Science
Mathematics
Measurement and Data
Physical Science
Physics
Statistics and Probability
Material Type:
Activity/Lab
Provider:
Science Education Resource Center (SERC) at Carleton College
Provider Set:
Teach the Earth
Author:
Peter LaFemina
Date Added:
08/19/2020
How Many Is A Million?
Conditional Remix & Share Permitted
CC BY-NC-SA
Rating
0.0 stars

Roger Steinberg, Department of Natural Sciences, Del Mar College 5000 Dots by Computer (Click image to enlarge and download.)

(Note: this resource was added to OER Commons as part of a batch upload of over 2,200 records. If you notice an issue with the quality of the metadata, please let us know by using the 'report' button and we will flag it for consideration.)

Subject:
Biology
Geology
Life Science
Mathematics
Measurement and Data
Physical Science
Statistics and Probability
Material Type:
Diagram/Illustration
Simulation
Provider:
Science Education Resource Center (SERC) at Carleton College
Provider Set:
Teach the Earth
Author:
Roger Steinberg
Date Added:
09/09/2020
How Much Energy is on my Plate?
Conditional Remix & Share Permitted
CC BY-NC-SA
Rating
0.0 stars

This activity is part of the community collection of teaching materials on climate and energy topics. This activity was submitted by faculty as part of the CLEAN Energy Workshop, held in April, 2011.

(Note: this resource was added to OER Commons as part of a batch upload of over 2,200 records. If you notice an issue with the quality of the metadata, please let us know by using the 'report' button and we will flag it for consideration.)

Subject:
Biology
Geoscience
Life Science
Mathematics
Measurement and Data
Physical Science
Statistics and Probability
Material Type:
Activity/Lab
Provider:
Science Education Resource Center (SERC) at Carleton College
Provider Set:
Teach the Earth
Author:
Lane Seely, Karin Kirk
Date Added:
01/20/2022
How are Flow Conditions in Volcanic Conduits Estimated?
Conditional Remix & Share Permitted
CC BY-NC-SA
Rating
0.0 stars

SSAC Physical Volcanology module. Students build a spreadsheet to calculate velocity of rising magma in steady-state Plinian eruptions using conservation of mass and momentum.

(Note: this resource was added to OER Commons as part of a batch upload of over 2,200 records. If you notice an issue with the quality of the metadata, please let us know by using the 'report' button and we will flag it for consideration.)

Subject:
Biology
Life Science
Mathematics
Measurement and Data
Statistics and Probability
Material Type:
Activity/Lab
Provider:
Science Education Resource Center (SERC) at Carleton College
Provider Set:
Teach the Earth
Author:
chuck connor
Date Added:
05/07/2018
How should I shower?
Conditional Remix & Share Permitted
CC BY-NC-SA
Rating
0.0 stars

In this activity, students will investigate the questions: What are the benefits/costs of 3 varieties of shower head types: standard, low flow, massage spray? Which would be best for a homeowner? For the university dorms?

(Note: this resource was added to OER Commons as part of a batch upload of over 2,200 records. If you notice an issue with the quality of the metadata, please let us know by using the 'report' button and we will flag it for consideration.)

Subject:
Biology
Life Science
Mathematics
Measurement and Data
Statistics and Probability
Material Type:
Activity/Lab
Provider:
Science Education Resource Center (SERC) at Carleton College
Provider Set:
Teach the Earth
Author:
Margaret Sullivan
Date Added:
08/18/2022