SYNOPSIS: This lesson teaches students about the different steps in food production …
SYNOPSIS: This lesson teaches students about the different steps in food production and how each step contributes to climate change.
SCIENTIST NOTES: The lesson has students analyze carbon footprint from different sources of food. From production, packaging, transportation, consumption, and disposal, all these activities increase carbon footprint and cause harm to the environment. This lesson inspires students to take urgent action to reduce individual carbon footprint from the food system. All materials are well-sourced and were thoroughly fact-checked to ascertain their credibility. Thus, this lesson is recommended for teaching.
POSITIVES: -Students are able to connect climate change to their everyday life by thinking about what foods they eat and how they may impact the planet. -Students are able to analyze complex data in a way that is highly scaffolded and supported.
ADDITIONAL PREREQUISITES: -This is lesson 2 of 6 in our 6th-8th grade Climate Change, Food Production, and Food Security unit. -Students should be able to read a bar graph that has a key.
DIFFERENTIATION: -Teachers can assign the Teacher Slideshow on Google Classroom and students can submit their work independently. -For the Data Explorer section, teachers can use an open-ended version that has broad questions or a guided version that has more specific questions to help students identify trends. -Teachers can eliminate options in the guided research section if the options are overwhelming. -Teachers can review the Teacher Slideshow as a class and answer the questions as a whole group assignment.
Students investigate how sea levels might rise when ice sheets and ice …
Students investigate how sea levels might rise when ice sheets and ice caps melt. By constructing a pair of models, students can observe the effects of ice melt in two different situations.
In this design challenge lesson, students examine their school food system and …
In this design challenge lesson, students examine their school food system and develop an investigation about food waste in order to know what should change.
SYNOPSIS: In this lesson, students learn the story of William Kamkwamba, build …
SYNOPSIS: In this lesson, students learn the story of William Kamkwamba, build their own renewable-powered project, and share their project with the broader school community.
SCIENTIST NOTES: This lesson engages students to build a renewable energy product. It contains clear illustrations on how to create a product, test it out, and share the innovation with an audience. There are no misconceptions in this lesson. It is advised that this lesson be used in the classroom.
POSITIVES: -Students learn the inspiring story of William Kamkwamba and how he brought power to his community. -Students get to engineer with their hands!
ADDITIONAL PREREQUISITES: -This is lesson 4 of 6 in our 3rd-5th grade Renewable Energy unit. -You will need to procure a copy of The Boy Who Harnessed the Wind for this lesson. -The Investigate section of this lesson plan is listed as 40 minutes long. However, some students may need more time to finish their projects. Perhaps they could keep building their projects before school, at recess, after school, or at home. -It may be best to check with your administration or team teachers to see if your students can display their projects in a common area. Also, a "please do not touch" sign may be necessary for the display so your students' creations do not get broken. -This lesson may need to be postponed if it is not sunny or windy enough on that day.
DIFFERENTIATION: -You may not have enough specialized materials (small solar panel, hobby motor, etc.) for all students. Students can work in groups to share these limited materials. -If you decide to have your students present to another class, encourage every student to have a speaking part. -Perhaps you can allow students to bring in materials from home. Be mindful of students who have nicer materials and how other students feel if they are using school materials only.
SYNOPSIS: In this lesson, students investigate plant growth by measuring their own …
SYNOPSIS: In this lesson, students investigate plant growth by measuring their own plants.
SCIENTIST NOTES: This lesson lets students discover the importance of plants in their environment and the basic materials plants need for growth. It also contains an activity for students to measure plant growth rate so as to discuss the factors that influence plant growth. All the accompanying materials in the lesson are well-sourced, and this lesson has passed our science credibility review.
POSITIVES: -This lesson includes elements of project-based learning through hands-on activities. -This lesson is cross curricular. -The materials are easily accessible for teachers and can be collected by students from home. Consumable items can be collected from home, donated by families, or even local companies that support education. If donations are not possible, seed and bean costs are minimal and can be shared among multiple teachers in a school. -Parts of the lesson can be conducted outdoors to connect with nature.
ADDITIONAL PREREQUISITES: -For the Inquire section, students need access to outdoor space with living things to observe. -The lesson time is approximately 90 minutes, but the lesson also requires ~10 minutes daily for 2 weeks after the lesson to measure and log plant growth in their journals. -Students should have a basic understanding of the difference between living and nonliving things. -Students should have an understanding of what living things need to grow.
DIFFERENTIATION: -This lesson can be taught as three separate ~30 minute lessons. -Students can graph growth at the end of the 2-week time period showing how their plants changed. This is an assessment opportunity for teachers to determine understanding of measurement. -If there is no possibility of a nature walk or finding space outside for observation, substitutions can be made such as observing a living plant in a pot, a photograph of a space outside, a raised garden bed, etc. -Due to the hands-on aspects of this lesson, English language learners can engage and be supported with vocabulary in their native language. -The Plant Growth Journal can be edited to include additional writing opportunities. -Measurements can be made through standard or nonstandard units of measure. -Graphing can be included for students ready to engage in graphing based on grade level. -Enrichment lessons can be included through designing outdoor space at students' homes or creating a school garden.
This video succinctly explains the mechanism of the natural greenhouse effect and …
This video succinctly explains the mechanism of the natural greenhouse effect and the cause of global climate change (anthropogenic global warming). It is short, basic, and to the point. It's also available in 12 languages!
The simulation has several conditions in which students are able to collect …
The simulation has several conditions in which students are able to collect and analyze data. The first of these scenarios models the water table in an area where there has been no human development. Students observe the annual, cyclical pattern of the water table over a five-year time period, and then use this as the control for comparison to other scenarios. Students then investigate scenarios in which a city, or a city plus a farm, are added. Students can choose to add wells to the city and the farm and select well pumping rates to meet human consumption needs in the city. Wells that are added in the farm scenario have predetermined pumping rates and are active during the growing season only.
As students add wells and gather data, they observe the effects on the wetlands, outflow of the river, and changes to the water table. When a single cell on the map is selected, a graph is generated showing water table data over a five year period for that cell. Using the graphs, students can quantitatively make observations and use data in order to create computational models. They can analyze and interpret the results of pumping over time and the effect on the water table and river outflow. Students can calculate the area of the wetland using the graphs generated by the simulation for each scenario. Examining cross-sections of the map also encourages students to make qualitative observations.
Students can further investigate the relationship between surface and groundwater by adding a drought option to each scenario. Students will collect and analyze data as before, and draw conclusions across the investigated scenarios to understand the effects of drought. After examining current data and news articles from California, students are asked to construct explanations based on evidence collected in the simulation for how the availability of fresh water, in addition to natural hazards such as drought, and climate change, influence human activity.
(Note: this resource was added to OER Commons as part of a batch upload of over 2,200 records. If you notice an issue with the quality of the metadata, please let us know by using the 'report' button and we will flag it for consideration.)
This activity focuses on the role of photosynthesis in a sustainable future. …
This activity focuses on the role of photosynthesis in a sustainable future. Students explore the effect of photosynthesis and respiration in a 'closed systems' containing plankton, marine plants, and fish. By calculating carbon dioxide uptake and production in these systems, they predict a plant: animal ratio sufficient to maintain a system in carbon dioxide 'balance' for one hour.
(Note: this resource was added to OER Commons as part of a batch upload of over 2,200 records. If you notice an issue with the quality of the metadata, please let us know by using the 'report' button and we will flag it for consideration.)
This activity leads students through a sequence of learning steps that highlight …
This activity leads students through a sequence of learning steps that highlight the embedded energy that is necessary to produce various types of food. Students start by thinking through the components of a basic meal and are later asked to review the necessary energy to produce different types of protein.
This activity is part of the community collection of teaching materials on …
This activity is part of the community collection of teaching materials on climate and energy topics. This activity was submitted by faculty as part of the CLEAN Energy Workshop, held in April, 2011.
(Note: this resource was added to OER Commons as part of a batch upload of over 2,200 records. If you notice an issue with the quality of the metadata, please let us know by using the 'report' button and we will flag it for consideration.)
This short video, is the fifth in the National Academies Climate Change, …
This short video, is the fifth in the National Academies Climate Change, Lines of Evidence series. It focuses on greenhouse gases, climate forcing (natural and human-caused), and global energy balance.
In this activity, students use Google Earth and team up with fictional …
In this activity, students use Google Earth and team up with fictional students in Chersky, Russia to investigate possible causes of thawing permafrost in Siberia and other Arctic regions. Students explore the nature of permafrost and what the effects of thawing permafrost mean both locally and globally. Next, students use a spreadsheet to explore soil temperature data from permafrost boreholes and surface air temperature datasets from in and around the Chersky region for a 50-year time span.
The movement is too white, too privileged, and needs to be inclusive …
The movement is too white, too privileged, and needs to be inclusive of the voices of black, brown, indigenous, and those who are disproportionately affected by climate impacts.
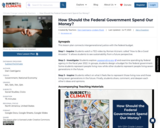
SYNOPSIS: This lesson plan connects intergenerational justice with the federal budget. SCIENTIST …
SYNOPSIS: This lesson plan connects intergenerational justice with the federal budget.
SCIENTIST NOTES: This lesson asks students to analyze how the U.S. federal government splits its budget amongst all of the federal agencies. The website used to track the spending is routinely updated. This lesson has passed the scientist quality assessment.
POSITIVES: -This is a powerful lesson connecting past, present, and future. -Students can have agency as to which group they'd like to represent: the present or the future.
ADDITIONAL PREREQUISITES: -The top 40 of 102 agencies by spending are included in the spreadsheet. The total (estimated) spending by all 40 of these agencies is $2,960,050,000,000. -The numbers presented at usaspending.gov are pretty messy. The attached spreadsheet rounds to cleaner numbers. -The numbers in red are rounded to the nearest billion. -The numbers in orange are rounded to the nearest hundred million. -The numbers in blue are rounded to the nearest fifty million. -Students may be missing some background knowledge. Be prepared to answer questions and/or do some research along with them. -For example, some students might not know the function of the Department of the Interior. -Feel free to use this site to look up the function of the major federal agencies. These are one-sentence explanations. -Feel free to also use this site from the White House where the major agencies (e.g., Agriculture, Defense) are outlined in one large paragraph. -Note that one “agency” is simply called “unreported data.” That data is not made public. Students can simply leave that $8 billion alone.
DIFFERENTIATION: -Students will most likely not finish. This is not really a “finishable” activity. The main goal of this activity is for students to figure out the best way to allocate money to the major federal agencies. -It is not really worth it to discuss the really small expenditures like the Administrative Conference of the U.S. -Students can wear armbands or robes to show that they are representing the future. Some physical representation of their role is a very powerful reminder of who they represent.
This video segment adapted from KET's Where the River Bends demonstrates how …
This video segment adapted from KET's Where the River Bends demonstrates how climate change and glacier movement during the Ice Ages destroyed the old Teays River and created the Ohio River, Kentucky's northern border.
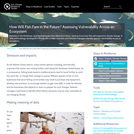
As the Atlantic Ocean warms, many marine speciesincluding commercially important fish stocksare …
As the Atlantic Ocean warms, many marine speciesincluding commercially important fish stocksare moving further north along the Northeast United States. As a consequence, fishing boats based in traditional ports need to travel further to catch the same fish, or change their strategy to pursue different species of fish. In turn, businesses that serve fishing communities may need to purchase new equipment, develop new practices, or encourage workers to gain new skills. In order for fisheries and the businesses that depend on them to prepare for such changes, fisheries managers need tools to identify which fishery resources may be most vulnerable to our changing climate.
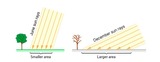
In this problem-based learning (PBL) activity, students take on the role of …
In this problem-based learning (PBL) activity, students take on the role of a student research scientist and explore the role of solar energy in determining climate. Students conduct experiments to observe how a change in water phase affects surface temperatures. Materials required for the investigation include 2 aquariums, dry sand or soil, two heat lamps, and two thermometers.The lesson is supported by teacher notes, answer key, glossary and an appendix with information about using PBL in the classroom. This is the second of three activities in Investigating the Climate System: Energy, a Balancing Act.
Students use basic aqueous geochemistry knowledge to investigate controls of the atmospheric …
Students use basic aqueous geochemistry knowledge to investigate controls of the atmospheric carbon dioxide level on pH values of the wet precipitation at standard conditions (25 oC, 1 atmospheric pressure).
(Note: this resource was added to OER Commons as part of a batch upload of over 2,200 records. If you notice an issue with the quality of the metadata, please let us know by using the 'report' button and we will flag it for consideration.)
SYNOPSIS: In this lesson, students learn about food insecurity and analyze potential …
SYNOPSIS: In this lesson, students learn about food insecurity and analyze potential solutions for their own community.
SCIENTIST NOTES: This lesson introduces students to what food insecurity and food deserts entail, how it adversely impacts vulnerable populations, low-income communities, and the world at large. It offers them the opportunity to brainstorm on ideas to address food insecurity in their communities and across different geographies. All materials in the lesson have been reviewed, and there is a high confidence in using this lesson in the classroom.
POSITIVES: -Students learn about difficult issues like food insecurity and food deserts but in the context of solution-based thinking. -Students think about and analyze their community and think of ways they can make a tangible difference.
ADDITIONAL PREREQUISITES: -This is lesson 5 of 6 in our 6th-8th grade Climate Change, Food Production, and Food Security unit. -Students should understand food insecurity isn’t just about hunger, but also malnutrition. -Students should understand that food insecurity is an issue for many people for a variety of different reasons, but there are potential solutions.
DIFFERENTIATION: -Teachers can assign the teacher slideshow on Google Classroom and students can submit their work independently. -Teachers can group students and assign them level-appropriate resources. -Teachers can eliminate options in the guided research section if the options are overwhelming. -Teachers can review the teacher slideshow as a class and answer the questions as a whole group assignment.
No restrictions on your remixing, redistributing, or making derivative works. Give credit to the author, as required.
Your remixing, redistributing, or making derivatives works comes with some restrictions, including how it is shared.
Your redistributing comes with some restrictions. Do not remix or make derivative works.
Most restrictive license type. Prohibits most uses, sharing, and any changes.
Copyrighted materials, available under Fair Use and the TEACH Act for US-based educators, or other custom arrangements. Go to the resource provider to see their individual restrictions.