In this activity, students create and interpret a water table contour map. …
In this activity, students create and interpret a water table contour map. Students utilize groundwater well elevations and the depth to the water table at each well to determine the water table elevation at each well location. Then they utilize that information to create a contour map of the water table and determine the direction of groundwater flow.
Students first study the movement of water in aquifers through a lecture …
Students first study the movement of water in aquifers through a lecture on Darcy's flow experiment. Then they practice applying the concepts of hydraulic conductivity and head differentials to 1 dimensional column examples. Next they use flow simulators to view flow through a cross section of an aquifer model. This activity is the final piece in the development of the idea of head driven flow. Students are given data about the thickness and head values of an aquifer member. They plot the aquifer thickness and potentiometric surface then determine the flow direction and estimate the groundwater flow velocity.
(Note: this resource was added to OER Commons as part of a batch upload of over 2,200 records. If you notice an issue with the quality of the metadata, please let us know by using the 'report' button and we will flag it for consideration.)
This lesson plan helps students understand the factors that affect water quality …
This lesson plan helps students understand the factors that affect water quality and the conditions that allow for different animals and plants to survive. Students will look at the effects of water quality on various water-related activities and describe water as an environmental, economic and social resource. The students will also learn how engineers use water quality information to make decisions about stream modifications.
The purpose of this investigation is to facilitate understanding of the basics …
The purpose of this investigation is to facilitate understanding of the basics of cloud formation involving the changing state of water. This activity should enhance the understanding of the change of state concept, which is important in the study of meteorology.
Students explore materials engineering by modifying the material properties of water. Specifically, …
Students explore materials engineering by modifying the material properties of water. Specifically, they use salt to lower the freezing point of water and test it by making ice cream. Using either a simple thermometer or a mechatronic temperature sensor, students learn about the lower temperature limit at which liquid water can exist such that even if placed in contact with a material much colder than 0 degrees Celsius, liquid water does not get colder than 0 °C. This provides students with an example of how materials can be modified (engineered) to change their equilibrium properties. They observe that when mixed with salt, liquid water's lower temperature limit can be dropped. Using salt-ice mixtures to cool the ice cream mixes to temperatures lower than 0 °C works better than ice alone.
Students learn about porosity and permeability and relate these concepts to groundwater …
Students learn about porosity and permeability and relate these concepts to groundwater flow. They use simple materials to conduct a porosity experiment and use the data to understand how environmental engineers decide on the placement and treatment of a drinking water well.
The simulation has several conditions in which students are able to collect …
The simulation has several conditions in which students are able to collect and analyze data. The first of these scenarios models the water table in an area where there has been no human development. Students observe the annual, cyclical pattern of the water table over a five-year time period, and then use this as the control for comparison to other scenarios. Students then investigate scenarios in which a city, or a city plus a farm, are added. Students can choose to add wells to the city and the farm and select well pumping rates to meet human consumption needs in the city. Wells that are added in the farm scenario have predetermined pumping rates and are active during the growing season only.
As students add wells and gather data, they observe the effects on the wetlands, outflow of the river, and changes to the water table. When a single cell on the map is selected, a graph is generated showing water table data over a five year period for that cell. Using the graphs, students can quantitatively make observations and use data in order to create computational models. They can analyze and interpret the results of pumping over time and the effect on the water table and river outflow. Students can calculate the area of the wetland using the graphs generated by the simulation for each scenario. Examining cross-sections of the map also encourages students to make qualitative observations.
Students can further investigate the relationship between surface and groundwater by adding a drought option to each scenario. Students will collect and analyze data as before, and draw conclusions across the investigated scenarios to understand the effects of drought. After examining current data and news articles from California, students are asked to construct explanations based on evidence collected in the simulation for how the availability of fresh water, in addition to natural hazards such as drought, and climate change, influence human activity.
(Note: this resource was added to OER Commons as part of a batch upload of over 2,200 records. If you notice an issue with the quality of the metadata, please let us know by using the 'report' button and we will flag it for consideration.)
This activity provides an opportunity for the student to collect data on …
This activity provides an opportunity for the student to collect data on their individual water use to set the stage for a unit on water resources.
(Note: this resource was added to OER Commons as part of a batch upload of over 2,200 records. If you notice an issue with the quality of the metadata, please let us know by using the 'report' button and we will flag it for consideration.)
Students keep track of their own water usage for one week, gaining …
Students keep track of their own water usage for one week, gaining an understanding of how much water is used for various everyday activities. They relate their own water usages to the average residents of imaginary Thirsty County, and calculate the necessary water capacity of a dam that would provide residential water to the community.
Students use basic aqueous geochemistry knowledge to investigate controls of the atmospheric …
Students use basic aqueous geochemistry knowledge to investigate controls of the atmospheric carbon dioxide level on pH values of the wet precipitation at standard conditions (25 oC, 1 atmospheric pressure).
(Note: this resource was added to OER Commons as part of a batch upload of over 2,200 records. If you notice an issue with the quality of the metadata, please let us know by using the 'report' button and we will flag it for consideration.)
This classroom activity allows students to use water surface temperature, bathymetric data …
This classroom activity allows students to use water surface temperature, bathymetric data and weather data to look at trends in the water temperature of the Great Lakes. The exercise asks students to make predictions, and then use the data to answer questions. The site contains everything that is needed for the exercise, including student handouts, maps, links to data sources, and background information and questions for discussion.
Students learn about the human water cycle, or how humans impact the …
Students learn about the human water cycle, or how humans impact the water cycle by settling down in civilizations. Specifically, they learn how people obtain, use and dispose of water. Students also learn about shortages of treated, clean and safe water and learn about ways that engineers address this issue through water conservation and graywater recycling.
This activity provides the hydrogeology students an exercise to understand specific discharge, …
This activity provides the hydrogeology students an exercise to understand specific discharge, hydraulic conductivity, and porous media. They will actually use a Darcy column to gather data on porous media, as well as calculate and understand the hydrologic properties of the materials.
(Note: this resource was added to OER Commons as part of a batch upload of over 2,200 records. If you notice an issue with the quality of the metadata, please let us know by using the 'report' button and we will flag it for consideration.)
In this exercise, students learn how to make a preliminary evaluation of …
In this exercise, students learn how to make a preliminary evaluation of the hydrogeology of a site. Students map the location and elevation of important hydrogeologic features, then produce a hydrogeologic map of the site, including a water profile and estimated flow paths for groundwater. This type of map is crucial for evaluating potential sources of groundwater, as well as potential sources of groundwater contamination.
(Note: this resource was added to OER Commons as part of a batch upload of over 2,200 records. If you notice an issue with the quality of the metadata, please let us know by using the 'report' button and we will flag it for consideration.)
This assignment is designed to expose students in my undergraduate 3 credit …
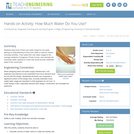
This assignment is designed to expose students in my undergraduate 3 credit non lab elective geohydrology course to a variety of hydrogeological environments and groundwater issues/problems that exist in the United States. Much of the course (field trip and local groundwater contamination case study) highlights and emphasizes understanding of the shallow unconsolidated aquifers in Michigan. Students use as their main source of information the data and illustration rich professional USGS Groundwater Atlases. Using this resource, in this activity students learn about the structure of aquifers in volcanic rock, karst and permafrost regions. They teach their fellow students about groundwater problems that result due due to overpumping, subsidence, sinkholes, saltwater intrusion and coal mining.
Key words: hydrogeologic environments, water supply and water quality problems, aquifers
(Note: this resource was added to OER Commons as part of a batch upload of over 2,200 records. If you notice an issue with the quality of the metadata, please let us know by using the 'report' button and we will flag it for consideration.)
This activity is a single, semester-long project that involves a hydrogeologic assessment …
This activity is a single, semester-long project that involves a hydrogeologic assessment of a property in Central Texas. The project is presented in the lab portion of a hydrogeology class, and it is broken into several separate steps. Each step is treated as a separate assignment, however, the data and results associated with each assignment are applied towards the overall goal of the project. Students are required to maintain a file and a master Excel workbook containing all information, data, and results from each of the steps. All this information is then used to develop an analytical model that simulated drawdowns in the aquifer. This model is used to answer the primary question associated with the project. The results are then documented in a technical report.
(Note: this resource was added to OER Commons as part of a batch upload of over 2,200 records. If you notice an issue with the quality of the metadata, please let us know by using the 'report' button and we will flag it for consideration.)
This activity is for students to work in teams (2012) or individually …
This activity is for students to work in teams (2012) or individually (2013) to develop a project (such as a physical or numerical model), survey based research, case study, technical briefs on a remediation technology, etc. of the students' choice, based on their understanding of and interest in the subjects covered in the class. This is used in the GL 199 Hydrogeology course, which is offered through the Department of Geology and Environmental Sciences at Norwich University. This is an experimental course that has not made it to the course catalogue as yet. It is currently offered to students majoring in Geology, with an acknowledgement that a course in hydrogeology is a desirable component of a Geology curriculum. Environmental Science students are encouraged to take it to deepen their understanding of subsurface processes. This course is considered a science elective for Civil and Environmental Engineering majors, and greatly complements the Hydrology, and Soils and Materials classes that are a part of the regular CE&E curriculum. Students from freshmen through seniors across these three majors are accepted into the course. With a cross section of majors and academic years in the class, it was determined that a project that has students thinking about a topic of their choice and developing fundamental research and collaboration skills is critical to meeting common workplace demands.
(Note: this resource was added to OER Commons as part of a batch upload of over 2,200 records. If you notice an issue with the quality of the metadata, please let us know by using the 'report' button and we will flag it for consideration.)
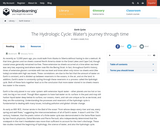
This module discusses the hydrologic cycle and its impacts on the planet …
This module discusses the hydrologic cycle and its impacts on the planet Earth. Additionally, the module addresses connections between the hydrologic cycle, climate and the impacts humans have had on the cycle.
This exercise is designed to evaluate the students' understanding of both the …
This exercise is designed to evaluate the students' understanding of both the hydrologic cycle and the water budget (mass balance) equation. In my course, the exercise is the students' first exposure to models in the course. While the exercise may seem basic, students gain experience in creating conceptual models and then generating mathematical models from the conceptual model. The exercise provides students with an introduction (or refresher) to some basic Excel formulas. Finally, the exercise can be modified to include more "what if" scenarios that require critical thinking and analysis from the students.
(Note: this resource was added to OER Commons as part of a batch upload of over 2,200 records. If you notice an issue with the quality of the metadata, please let us know by using the 'report' button and we will flag it for consideration.)
Relation of purpose of data to data requirements. Relation of data to …
Relation of purpose of data to data requirements. Relation of data to costs. Accuracy requirements of measurements and error propagation: Related to a problem the required accuracy of measurements and the consequences for accuracy in the final result are discussed. Different types of errors are handled. Propagation of errors; for dependent and independent measurements, from mathematical relations and regression is demonstrated. Recapitulated is the theory of regression and correlation. Interpretation of measurements, data completion: By standard statistical methods screening of measured data is performed; double mass analysis, residual mass, simple rainfall-runoff modelling. Detection of trends; split record tests, Spearman rank tests. Methods to fill data gaps and do filtering on data series for noise reduction. Methods of hydrological measurements and measuring equipment: To determine quantitatively the most important elements in the hydrological cycle an overview is presented of most common hydrological measurements, measuring equipment and indirect determination methods i.e. for precipitation, evaporation, transpiration, river discharge and groundwater tables. Use, purpose and measurement techniques for tracers in hydrology is discussed. Advantages and disadvantages and specific condition/application of methods are discussed. Equipment is demonstrated and discussed. Areal distributed observation: Areal interpolation techniques of point observations: inverse distance, Thiessen, contouring, Kriging. Comparison of interpolation techniques and estimation of errors. Correlation analysis of areal distributed observation of rainfall Design of measuring networks: Based on correlation characteristics from point measurements (e.g. rainfall stations) and accuracy requirements the design of a network of stations is demonstrated.
No restrictions on your remixing, redistributing, or making derivative works. Give credit to the author, as required.
Your remixing, redistributing, or making derivatives works comes with some restrictions, including how it is shared.
Your redistributing comes with some restrictions. Do not remix or make derivative works.
Most restrictive license type. Prohibits most uses, sharing, and any changes.
Copyrighted materials, available under Fair Use and the TEACH Act for US-based educators, or other custom arrangements. Go to the resource provider to see their individual restrictions.