This lab allows students to look at variety of data from the …
This lab allows students to look at variety of data from the North Anatolian fault in Turkey. Specifically, students have the oportunity to:
interpret seismograms from the Izmit earthquake in 1999 (while accessing some seismograph station information from IRIS) make and interpret an earthquake focal mechanism solution based on these seismograms locate the earthquake epicenter calculate the moment magnitude of the earthquake using published data showing epicenter locations and displacement measurements intepret historical data from the North Anatolian fault and tectonic-scale plate motion information to see what patterns occur in the regional seismicity.
(Note: this resource was added to OER Commons as part of a batch upload of over 2,200 records. If you notice an issue with the quality of the metadata, please let us know by using the 'report' button and we will flag it for consideration.)
Spreadsheets Across the Curriculum/Geology of National Parks Collection. Students create a histogram …
Spreadsheets Across the Curriculum/Geology of National Parks Collection. Students create a histogram to examine the time between geyser eruptions of Old Faithful, Yellowstone National Park.
(Note: this resource was added to OER Commons as part of a batch upload of over 2,200 records. If you notice an issue with the quality of the metadata, please let us know by using the 'report' button and we will flag it for consideration.)
An assignment teaching students about Kohler curves that enhances their quantitative skills. …
An assignment teaching students about Kohler curves that enhances their quantitative skills.
(Note: this resource was added to OER Commons as part of a batch upload of over 2,200 records. If you notice an issue with the quality of the metadata, please let us know by using the 'report' button and we will flag it for consideration.)
The purpose of this exercise is to integrate modeling with field data. …
The purpose of this exercise is to integrate modeling with field data. The activity includes links to a "virtual field trip" of maps and photographs. Data from a creek is included in the field trip and students use an Excel spreadsheet model to analyze the data.
(Note: this resource was added to OER Commons as part of a batch upload of over 2,200 records. If you notice an issue with the quality of the metadata, please let us know by using the 'report' button and we will flag it for consideration.)
Using data on the world's water distribution, students calculate the percentage of …
Using data on the world's water distribution, students calculate the percentage of water that is available to humans and examine graphics that illustrate the distribution. Students develop a sense of where the world's water is located and how it moves through the Earth system.
(Note: this resource was added to OER Commons as part of a batch upload of over 2,200 records. If you notice an issue with the quality of the metadata, please let us know by using the 'report' button and we will flag it for consideration.)
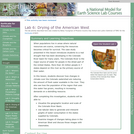
When populations live in areas where natural resources are scarce, conserving them …
When populations live in areas where natural resources are scarce, conserving them becomes critical for survival. The case study presented in this lesson introduces students to a real drought that has been developing in the Colorado River basin for many years. The Colorado River is the major source of water for people in the driest part of the United States. More than 30 million people in 7 states depend on this river as the primary source of their water. In this lesson, students discover how changes in climate over the Colorado watershed are reducing the amount of fresh water available in the river. They also see how the population of the region that uses this water has grown, resulting in increasing demands on a dwindling resource.
(Note: this resource was added to OER Commons as part of a batch upload of over 2,200 records. If you notice an issue with the quality of the metadata, please let us know by using the 'report' button and we will flag it for consideration.)
In this physical geography lab, students examine the relationship between solar altitude, …
In this physical geography lab, students examine the relationship between solar altitude, solar declination, and temperature regimes. Using data collected in the field, mathematical relationships, and temperature records available on the Internet, students compare the insolation and climate in their location to that of other locations.
(Note: this resource was added to OER Commons as part of a batch upload of over 2,200 records. If you notice an issue with the quality of the metadata, please let us know by using the 'report' button and we will flag it for consideration.)
Students use the modeling program STELLA to see what combinations of runoff …
Students use the modeling program STELLA to see what combinations of runoff and evaporation might have lead to Pleistocene lake level oscillations in California's Owens River system.
(Note: this resource was added to OER Commons as part of a batch upload of over 2,200 records. If you notice an issue with the quality of the metadata, please let us know by using the 'report' button and we will flag it for consideration.)
Stratified lakes exhibit vertical gradients in organisms, nutrients, and oxygen, which have …
Stratified lakes exhibit vertical gradients in organisms, nutrients, and oxygen, which have important implications for ecosystem structure and functioning. Mixing disrupts these gradients by redistributing these materials throughout the water column. Consequently, it is critical to understand the drivers of lake mixing and thermal stratification, especially because of the sensitivity of lake thermal conditions to altered climate. In this module, students will explore spatial and temporal patterns of lake mixing using high-frequency temperature data from lakes around the world. They will also explore how increases in air temperature affect thermal stratification by interpreting output from a lake model. Project EDDIE modules are designed with an A-B-C structure to make them flexible and adaptable to a range of student levels and course structures.
(Note: this resource was added to OER Commons as part of a batch upload of over 2,200 records. If you notice an issue with the quality of the metadata, please let us know by using the 'report' button and we will flag it for consideration.)
This module was initially developed by Carey, C.C., J.L. Klug, and R.L. Fuller. 1 August 2015. Project EDDIE: Dynamics of Lake Mixing. Project EDDIE Module 3, Version 1. cemast.illinoisstate.edu/data-for-students/modules/lake-mixing.shtml. Module development was supported by NSF DEB 1245707.
Students create a STELLA model of two marine terrace platforms separated in …
Students create a STELLA model of two marine terrace platforms separated in elevation by a cliff, using the hillslope flux equation to simulate the change in the cliff face over time as diffusive processes tear it down.
(Note: this resource was added to OER Commons as part of a batch upload of over 2,200 records. If you notice an issue with the quality of the metadata, please let us know by using the 'report' button and we will flag it for consideration.)
Unit composed of 3 exercises designed to expose students to the physical …
Unit composed of 3 exercises designed to expose students to the physical processes that lead to landslides and how scientists model these processes.
(Note: this resource was added to OER Commons as part of a batch upload of over 2,200 records. If you notice an issue with the quality of the metadata, please let us know by using the 'report' button and we will flag it for consideration.)
Spreadsheets Across the Curriculum module/Geology of National Parks course. Students use a …
Spreadsheets Across the Curriculum module/Geology of National Parks course. Students use a topographic map and spreadsheet to find how many Big Macs they burned off on a five-mile hike at Catoctin Mountain Park.
(Note: this resource was added to OER Commons as part of a batch upload of over 2,200 records. If you notice an issue with the quality of the metadata, please let us know by using the 'report' button and we will flag it for consideration.)
Students learn about the weighted mean by building spreadsheets that apply this …
Students learn about the weighted mean by building spreadsheets that apply this concept to the average density of the oceanic lithosphere.
(Note: this resource was added to OER Commons as part of a batch upload of over 2,200 records. If you notice an issue with the quality of the metadata, please let us know by using the 'report' button and we will flag it for consideration.)
The goal of this exercise is to illustrate how each municipality needs …
The goal of this exercise is to illustrate how each municipality needs to have a energy portfolio that is specific to their needs.
The students analyze a spreadsheet that links % of energy types to 6 output categories; cost, environmental impact, NIMBY, and three types of industrial emissions. As the students input % values for each energy type the overall value of each output category is calculated.
The challenge is for the students to come up with energy plans for multiple cities. Each of these cities would have different limits on either the maximum % of an energy type or one of the specific categories.
Example: Detroit, Michigan would use a low cap on the cost category so their energy plan would need to be very affordable. Seattle, Washington would only allow for 2-3% solar because climactic conditions don't favor solar energy.
For the last portion of the activity the students would come up with a plan for their own town and then be able to look up the current plan at https://www.epa.gov/egrid/power-profiler#/. They could then discuss how their plan and the currently implemented plan compare.
A variety of quantitative approaches to Congressional elections in which students learn …
A variety of quantitative approaches to Congressional elections in which students learn the causes of electoral outcomes, the predictability of those outcomes, and intervening variables that produce unexpected outcomes.
This exercise is centered around a suite of rocks from the Sierra …
This exercise is centered around a suite of rocks from the Sierra Nevada batholith. The activities are designed to give petrology students a capstone experience for the igneous portion of the upper-level Petrology course. Students are given thin sections with hand samples, a map and a table of geochemical analyses (in Excel format) and asked to record hand-sample and thin section observations with the idea that these will be used to understand processes that were active during batholith generation. By the time they encounter this lab, the students have spent at least 7 lab periods looking at a variety of igneous rocks and their textures. Because students are given geochemical analyses, they are also expected to experiment with the use of graphs (e.g., Harker and spider diagrams) to better understand tables of geochemical analyses. The students use observations about rocks and geochemistry to build a coherent story around these rocks; the final product is a short paper in which they use petrographic observations and geochemical diagrams to back up their interpretations.
(Note: this resource was added to OER Commons as part of a batch upload of over 2,200 records. If you notice an issue with the quality of the metadata, please let us know by using the 'report' button and we will flag it for consideration.)
Dissolved ions are present in all freshwater systems, but humans can change …
Dissolved ions are present in all freshwater systems, but humans can change the chemical composition of freshwater in several ways. In this activity, students will examine the concentration of major ions in freshwater systems over time and reason about potential drivers of these changes.
(Note: this resource was added to OER Commons as part of a batch upload of over 2,200 records. If you notice an issue with the quality of the metadata, please let us know by using the 'report' button and we will flag it for consideration.)
Many people live in regions prone to earthquakes, tsunamis and volcanic eruptions, …
Many people live in regions prone to earthquakes, tsunamis and volcanic eruptions, but the hazards and risks inherent in our communities may be very different. Making connections with learners from another location is a great way to share knowledge and practice science communication skills. Video conferencing applications like Zoom and Skype make it possible to connect with learners anywhere in the world. This activity provides a simple protocol, and a form for submitting a request to connect with a classroom teacher in Anchorage, Alaska.
(Note: this resource was added to OER Commons as part of a batch upload of over 2,200 records. If you notice an issue with the quality of the metadata, please let us know by using the 'report' button and we will flag it for consideration.)
Spreadsheets Across the Curriculum/Geology of National Parks module. Students work with a …
Spreadsheets Across the Curriculum/Geology of National Parks module. Students work with a color-coded conditional-formatted spreadsheet map to work through a USGS report applying a coastal vulnerability index.
(Note: this resource was added to OER Commons as part of a batch upload of over 2,200 records. If you notice an issue with the quality of the metadata, please let us know by using the 'report' button and we will flag it for consideration.)
Students use an interactive online mass balance model help understand the observed …
Students use an interactive online mass balance model help understand the observed levels of chlorofluorocarbon CFC-12 over the recent past.
(Note: this resource was added to OER Commons as part of a batch upload of over 2,200 records. If you notice an issue with the quality of the metadata, please let us know by using the 'report' button and we will flag it for consideration.)
No restrictions on your remixing, redistributing, or making derivative works. Give credit to the author, as required.
Your remixing, redistributing, or making derivatives works comes with some restrictions, including how it is shared.
Your redistributing comes with some restrictions. Do not remix or make derivative works.
Most restrictive license type. Prohibits most uses, sharing, and any changes.
Copyrighted materials, available under Fair Use and the TEACH Act for US-based educators, or other custom arrangements. Go to the resource provider to see their individual restrictions.