Using the 5E instructional model, students discover the value of using color …
Using the 5E instructional model, students discover the value of using color maps to visualize data. The activity requires students to create a color map of the ozone hole from Dobson data values derived from the Aura satellite. Students then interpret that map and compare and evaluate different color scales. Note that this is the Spanish version of Exploring Color Maps: Using Stratospheric Ozone Data.
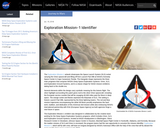
NASA released the Exploration Mission-1 (EM-1) emblem. Launching from a modernized Kennedy …
NASA released the Exploration Mission-1 (EM-1) emblem. Launching from a modernized Kennedy Space Center, EM-1 is the first integrated flight of the Orion Spacecraft and the Space Launch System (SLS) rocket. To learn more, visit https://www.nasa.gov/content/j2m-getting-to-mars-sls-and-orion.
In this activity, student teams conduct a quantitative exploration of the connections …
In this activity, student teams conduct a quantitative exploration of the connections between parts of the Earth system, through examination of a time series of environmental data maps. By investigating the connections between environmental data, they see how Earth processes interact on varying time and spatial scales.This is one of six interrelated learning activities in the student activity guide associated with the GLOBE Earth System Poster, “Exploring Connections in Year 2007.” A series of assessment and extension activities are included.
Through the use of the 5E instructional model, students discover the value …
Through the use of the 5E instructional model, students discover the value of using color maps to visualize data. The activity requires students to create a color map of the ozone hole from Dobson data values derived from the Aura satellite. Students then interpret that map and compare and evaluate different color scales.
This is a lesson about using analogues to look for life on …
This is a lesson about using analogues to look for life on other planets. Learners will use the results of previous lessons to write a scientific proposal to explore another planet or moon in our solar system for signs of life. This proposal should predict the types of energy and nutrients available to sustain life and describe equipment and instruments necessary for exploration and characterization of the target environment. This is activity 4, the capstone activity, in Exploring Deep-Subsurface Life. Earth Analogues for Possible Life on Mars: Lessons and Activities.
This is an activity about ellipses, their focal points, and how the …
This is an activity about ellipses, their focal points, and how the mathematics involved pertains to planetary orbits. Learners will draw their own ellipse using a string and pencil and calculate the minimum and maximum distance from the Sun for each of the planets. This activity requires access to the Space Weather software and is Solar System Activity 5 in a larger resource, titled Space Update.
Student teams explore atmospheric aerosols, dust, and fires and their impact on …
Student teams explore atmospheric aerosols, dust, and fires and their impact on the Earth's albedo using NASA Earth Observations (NEO) website. This is an extension activity in the student learning activity guide accompanying the GLOBE Earth System Poster, Exploring Connections in Year 2007. A series of six learning activities and associated assessment activities are included.
This is a collection of mathematics problems relating to the moons of …
This is a collection of mathematics problems relating to the moons of the solar system. Learners will use simple proportional relationships and work with fractions to study the relative sizes of the larger moons in our solar system, and explore how temperatures change from place to place using the Celsius and Kelvin scales.
In this activity, student teams explore connections between parts of the Earth …
In this activity, student teams explore connections between parts of the Earth system, by examining a time series of environmental data maps. By examining scientific visualizations of a data pair in two time slices, they will see that the environment is the result of the interplay among many processes that take place on varying time and spatial scales. This is one of six interrelated learning activities associated with the GLOBE Earth System Poster, Exploring Connections in Year 2007, which also includes a series of assessment and extension activities. GLOBE (Global Learning and Observation to Benefit the Environment) is a worldwide, hands-on, K-12 school-based science education program.
In this activity, student teams explore the connections between parts of the …
In this activity, student teams explore the connections between parts of the Earth system by examining a time series of environmental data maps. They observe that the environment is the result of the interplay among many processes that take place on varying time and spatial scales, by looking at different six different variables during a single month: insolation, surface temperature, cloud fraction, aerosols, precipitation and biosphere (surface vegetation). This is one of six interrelated learning activities in the student activity guide associated with the GLOBE Earth System Poster, Exploring Connections in Year 2007. A series of assessment and extension activities are included. GLOBE (Global Learning and Observation to Benefit the Environment) is a worldwide, hands-on, K-12 school-based science education program. GLOBE (Global Learning and Observation to Benefit the Environment) is a worldwide, hands-on, K-12 school-based science education program.
In this activity, student teams explore the connections between parts of the …
In this activity, student teams explore the connections between parts of the Earth system by examining a time series of environmental data maps. Each student teams examines images for two variables and determines if there is a direct or inversely proportional relationship exhibited between them throughout the year. The variable pairs that student groups are observing include: insolation and surface temperature; cloud fraction and precipitation; aerosols and biosphere. This is one of six interrelated learning activities associated with the GLOBE Earth System Poster, "Exploring Connections in Year 2007," and includes a series of assessment and extension activities. GLOBE (Global Learning and Observation to Benefit the Environment) is a worldwide, hands-on, K-12 school-based science education program.
In this activity, student teams explore connections between parts of the Earth …
In this activity, student teams explore connections between parts of the Earth system, by examining a time series of environmental data maps. Each team examines a single variable displayed on a global data map, and identify the unit of measure, the range of values, and patterns they observe in the data. Variables include: insolation, surface temperature, precipitation, cloud fraction, aerosols, biopshere. This is one of six interrelated learning activities associated with the GLOBE Earth System Poster, "Exploring Connections in Year 2007," and includes a series of assessment and extension activities. GLOBE (Global Learning and Observation to Benefit the Environment) is a worldwide, hands-on, K-12 school-based science education program.
This book introduces students to some of the most unusual places in …
This book introduces students to some of the most unusual places in our galaxy outside of our solar system. Answering the question, "How many stars are in the sky?" introduces students to basic counting, tallying, and grouping techniques, as well as allowing for the use of simple proportions.
Students will explore time series plots and raw data to understand the …
Students will explore time series plots and raw data to understand the role of sea surface temperature increases on arctic ice melt. This is part three of a four-part activity on polar science. The activity builds on the knowledge gained in Using Data and Images to Understand Albedo (part 2). Extension activities examining air and sea surface temperature in relation to changing Earth albedo are included. Information is provided on data access using the NOAA Earth System Research Laboratory Web site. This activity is one of several learning activities connected with the 2007 GLOBE Earth system poster.
As science extension activities, this book of problems introduces students to mapping …
As science extension activities, this book of problems introduces students to mapping the shape of the Milky Way galaxy, and how to identify the various kinds of galaxies in our universe. Students also learn about the shapes and sizes of other galaxies in our universe as they learn how to classify them. The math problems cover basic scientific notation skills and how they apply to working with astronomically large numbers. It also provides exercises in plotting points on a Cartesian plane to map the various features of our Milky Way.
This is an activity about the solar activity cycle. Learners will construct …
This is an activity about the solar activity cycle. Learners will construct a graph to identify a pattern of the number of observed sunspots and the number of coronal mass ejections emitted by the Sun over a fifteen year time span. A graphing calculator is recommended, but not required, for this activity. This is the second activity in the Solar Storms and You: Exploring the Wind from the Sun educator guide.
This is a lesson about extremophiles and using DNA sequences to classify …
This is a lesson about extremophiles and using DNA sequences to classify them. Learners will describe the characteristics of a newly discoverd thermophyllic organism and use the DNA sequence to place that organism in the phylogenetic tree of life. Includes teacher notes, learning objectives, and assessment of prior knowledge and preconceptions. This is Lesson 3 in Exploring Deep-Subsurface Life. Earth Analogues for Possible Life on Mars: Lessons and Activities
Research physical scientist, Dr. Dalia Kirschbaum, is featured in this short (~3 …
Research physical scientist, Dr. Dalia Kirschbaum, is featured in this short (~3 min.) video. Dr. Kirschbaum explains how the integration of her initial interest in math and her subsequent interest in the science of natural disasters lead to her career focus of landslide modeling. Now part of the NASA Global Precipitation Measurement (GPM) team, she communicates about the GPM mission and data to the public and to others who use it in their work and/or research.
This activity shows how an ordinary ruler can measure human reaction time …
This activity shows how an ordinary ruler can measure human reaction time (RT). Learners will convert a standard ruler into a time ruler (relating time and distance) and measure each others RT. They will also calculate means and variances and the RT required to accomplish a specific task. Additional resources and an extension to this activity are available. This resource is from PUMAS - Practical Uses of Math and Science - a collection of brief examples created by scientists and engineers showing how math and science topics taught in K-12 classes have real world applications.
No restrictions on your remixing, redistributing, or making derivative works. Give credit to the author, as required.
Your remixing, redistributing, or making derivatives works comes with some restrictions, including how it is shared.
Your redistributing comes with some restrictions. Do not remix or make derivative works.
Most restrictive license type. Prohibits most uses, sharing, and any changes.
Copyrighted materials, available under Fair Use and the TEACH Act for US-based educators, or other custom arrangements. Go to the resource provider to see their individual restrictions.