Each student randomly picks a card with a geologic event (written description …
Each student randomly picks a card with a geologic event (written description and an image) on it. A timeline has 11 events, not including the formation of the Earth and today. Students attach their event where they think it should go on a 45.5' timeline (in the hallway) made out of paper adding tape and mark the location on the timeline. They return to the classroom and receive a list of age dates for each event. Each group figures out the scale (1 foot = 100 million years) and then moves their events to the correct locations. Students are asked how the position of the events changed, and answer other questions that reinforce the difference between human timescales and geologic timescales.
The powerpoint file below contains a template for making geologic event labels for the index cards. Instructors can tailor the geologic event list to fit their course.
(Note: this resource was added to OER Commons as part of a batch upload of over 2,200 records. If you notice an issue with the quality of the metadata, please let us know by using the 'report' button and we will flag it for consideration.)
Students will begin this lesson by ordering the events of their morning …
Students will begin this lesson by ordering the events of their morning using relative and absolute dating techniques. Students will also write a personal definition of the terms absolute age and relative age. Next, students will work with collaborative groups to order events in Earth's geologic history by relative age, then order those same events by absolute age in a scaled model timeline. Lastly, students will use the time-scale model created with their group members to analyze events in Earth's geologic history. This lesson results from a collaboration between the Alabama State Department of Education and ASTA.
In this lesson, students will learn what erosion is and how human …
In this lesson, students will learn what erosion is and how human actions influence erosion. Includes introduction, demonstration instructions, and questions for wrap-up discussion.
NGSS: 4-ESS2-1
Time: 55 minutes
Materials: plastic containers with sand and gravel, sponges, and plastic cups
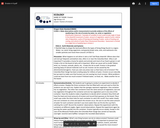
This exercise requires students to answer some questions about stress and fault …
This exercise requires students to answer some questions about stress and fault mechanics that relate to geologic maps. In part A) students must draw a cross section and Mohr circles and make some calculations to explain the slip history and mechanics of two generations of normal faults. In part B) students interpret the faulting history and fault mechanics of the Yerington District, Nevada, based on a classic geologic map and cross section by John Proffett. keywords: geologic map, cross section, normal faults, Mohr circle, Coulomb failure, Andersonian theory, frictional sliding, Byerlee's law
(Note: this resource was added to OER Commons as part of a batch upload of over 2,200 records. If you notice an issue with the quality of the metadata, please let us know by using the 'report' button and we will flag it for consideration.)
Short Description: This is an inquiry based field investigation where students gather …
Short Description: This is an inquiry based field investigation where students gather data on the Credit River from the rocks in the river bed, water speed, and maps. Students interpret their findings and develop new questions.
This activity helps students understand how geoscientists study the Earth below our …
This activity helps students understand how geoscientists study the Earth below our feet through drilling. Using a large straw as a "drill", students collect samples through different parts of the specially layered cupcake and keep a "log" of the drill core. By defining different colored cake and filling, they can reconstruct what the interior of the cupcake may look like. Students gain an appreciation for the challenges of determining a plausible geologic interpretation with limited data.
(Note: this resource was added to OER Commons as part of a batch upload of over 2,200 records. If you notice an issue with the quality of the metadata, please let us know by using the 'report' button and we will flag it for consideration.)
In this unit, students will identify mass extinctions as paleontologists have done …
In this unit, students will identify mass extinctions as paleontologists have done and recognize and understand the "pull of the recent," that is, the human tendency to know more about events closer to the present. Students prepare by reading an article prior to class that describes mass extinctions. At the beginning of class, students place historical events along a physical model of the geologic timescale. Next, they examine a diagram showing changes in biodiversity across the last 542 million years and identify patterns in those data. Students and the instructor then finish class by discussing that although fossils (and rocks) are critical for explaining the present and predicting the future, their mechanisms of preservation biases our understanding of Earth's past.
(Note: this resource was added to OER Commons as part of a batch upload of over 2,200 records. If you notice an issue with the quality of the metadata, please let us know by using the 'report' button and we will flag it for consideration.)
This activity utilizes Visible Geology to analyze folds on a stereonet using …
This activity utilizes Visible Geology to analyze folds on a stereonet using a pi-girdle technique. The assignment starts with students following a simple example, and then creating their own and sharing it with a partner. Students are introduced to concepts of fold axis, axial plane, interlimb angle in three-visualizations: model view, cross-section view, and stereonet view. By moving between these media students are able to draw deeper connections with respect to folding and to stereonet interpretation.
(Note: this resource was added to OER Commons as part of a batch upload of over 2,200 records. If you notice an issue with the quality of the metadata, please let us know by using the 'report' button and we will flag it for consideration.)
Much of what we know about the geologic history of Earth is …
Much of what we know about the geologic history of Earth is based on information in rocks now exposed at Earth's surface. Research into Earth history is much like research into human history, but instead of searching through accounts written on sheets of paper as historians do, geologists examine layers of rock. Relative dating of geologic features involves putting geological events in a correct time sequence from oldest to youngest. Absolute dating yields a number (years or Ma = mega-anna = millions of years). In this exercise, students learn and apply the concepts geologists use to determine the relative and absolute ages of rocks. Student materials for this exercise include a Microsoft Excel spreadsheet with with data for radioactive decay and isotopic dating and an MS Word instruction sheet. The exercise is divided into three parts. In Part I, students study stratigraphic principles and use them to interpret both a map and a vertical cross section. The Geologic Column is introduced in relative terms. Part II involves calculating the fractions of parent and daughter isotopes in samples using the equation for radioactive decay and the decay constants for three isotopic systems (40K-40Ar, 238U-206U, and 14C-14N). Students also graph their results and interpret the graphs in terms of half-life and decay constants. In Part III, students calculate isotopic ages for three rocks, bracket the ages of undateable rocks, and interpret the Geologic Time Scale in absolute terms.
(Note: this resource was added to OER Commons as part of a batch upload of over 2,200 records. If you notice an issue with the quality of the metadata, please let us know by using the 'report' button and we will flag it for consideration.)
This lab introduces students to Thermal infrared Imagery and then asks them …
This lab introduces students to Thermal infrared Imagery and then asks them to evaluate which wavelengths (VIS, NIR, SWIR, or TIR) are the best choices to identify and discriminate between geologic materials. The lab focuses on the Geology in the Lake Mead Region east of Las Vegas, NV; the lab uses a Landsat image and a MASTER image of the area. Students get experience with a classic band combination using TIR to identify rock types and with making decisions on which wavelengths to use in identifying surface materials.
Students are divided into teams, each charged with writing a plan for …
Students are divided into teams, each charged with writing a plan for the expansion of a fictional town in the North Cascades foothills. The town council (the instructor) has decided upon several expansion projects, such as an airport and housing subdivisions, and the student teams receive information about the bedrock geology, hydrology, soils, and slope stability of the area. Students present their plans in a open forum to the other students, and there is a vote of the students on the most reasonable science-based plan.
(Note: this resource was added to OER Commons as part of a batch upload of over 2,200 records. If you notice an issue with the quality of the metadata, please let us know by using the 'report' button and we will flag it for consideration.)
Students download diversity data from the PBDB for Veneridae and Hippuritoida bivalves …
Students download diversity data from the PBDB for Veneridae and Hippuritoida bivalves and plot diversity curves in Excel to illustrate the rapid diversification of these bivalves and the timing of extinction of Hippuritoida. This portion of the lab reinforces concepts discussed in class such as origination and extinction. Students use the mapping software contained in the PBDB to plot distributions of bivalves for the Devonian, Cretaceous and Pleistocene and consider their relationship to changes in sea-level. Animal migration is illustrated using ungulate and horse fossil distributions. For example, students create maps that plot the location of horse fossils in the Oligocene, Middle Miocene, Late Miocene, Pliocene, and Pleistocene. By doing so, students are able to constrain the timing of the formation of the Panama land bridge. This exercise reinforces the importance of the relationship between continental configuration and animal migration over geologic time scales.
(Note: this resource was added to OER Commons as part of a batch upload of over 2,200 records. If you notice an issue with the quality of the metadata, please let us know by using the 'report' button and we will flag it for consideration.)
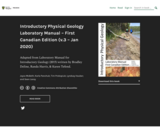
Short Description: "An Introduction to Geological Field Trips: Case Study Avonlea Badlands, …
Short Description: "An Introduction to Geological Field Trips: Case Study Avonlea Badlands, Saskatchewan" emerged out of the passion of a few people for fieldwork. During the COVID-19 pandemic there was a real need to replace the actual field trips - forbidden during the pandemic - with something else that will give the student a taste or a tease of fieldwork. More than being the conclusion, this project wants to be the inspiration that will carry the student out of the classroom and into the field. Consequently, how do you prepare for a field trip? It is easy to assume that somebody else will know everything about the area where you're going and you're just going along for the ride - because at the end of the day you are there to learn. Absolutely true, but being mentally prepared will make everything seem less overwhelming, less foreign and consequently, way more enjoyable. Yet, even the preparation process can feel like a big white elephant in the room. Where do you start? Obviously with the first page of the book.The authors are grateful to receive funding support from the University of Regina’s OER Publishing Program Small Project Grant, which enabled us to actually carry real fieldwork in the Avonlea Badlands in Southern Saskatchewan to collect all the data for this book.
Long Description: “An Introduction to Geological Field Trips: Case Study Avonlea Badlands, Saskatchewan” is trying to fill the gap between the student and the fieldwork. Most commonly, the geology student is thrown into the fire while in the field trips and has to process a lot of information on the fly. Consequently, sometimes is hard to see the full picture. This book wants to be the starting point for every student looking to embark in that first geological field trip. How to prepare? What to do? How to approach the field work? Which data should be collected? Where to start? It is a work in progress and as the students will learn more about preparation so, too, the authors will learn more and more about the questions that the student has before, during and after the field trip. We are grateful to all the people that contributed to this book. Your dedication to student success is admirable!
Word Count: 17033
ISBN: ISBN-13:978-0-7731-0780-9
(Note: This resource's metadata has been created automatically by reformatting and/or combining the information that the author initially provided as part of a bulk import process.)
This is a lab/project in which the students not only name and …
This is a lab/project in which the students not only name and identify a suite of granitic rocks but try to piece together the tectonic and geologic history of the Idaho batholith. This activity brings together the process of naming rocks, determining the I-, S- and A-type nature of the rocks, estimating magma source and potential assimilants, a nonquantitative depth of intrusion for the suites, and any distinctive textures that might help tell the story of the batholith. It forces students to move outside the rock in a box lab for granites and create a regional geologic history.
I find this project to work well in class for a number of reasons. Group work and counting on your classmates to interpret the rocks is a foundation of the entire project. The students get exposed to more rocks than in a typical lab without having to identify each of the in great detail since they are ultimately only responsible for their own suite. I have removed at least one lecture on granites and replaced it with this project for them to do the interpretation themselves rather than just passively absorb the geology.
The students have just a basic introduction to I-, A- and S-type granites and the models for the generation of these magmas. They have already learned about grain size relating to cooling rate and depth of intrusion, but it usually is awhile since they thought about these concepts.
Obviously this project depends on the exact samples being available, but the theory of the project can be applied to numerous geologic settings.
(Note: this resource was added to OER Commons as part of a batch upload of over 2,200 records. If you notice an issue with the quality of the metadata, please let us know by using the 'report' button and we will flag it for consideration.)
In this two-part example, students are given clues about properties about the …
In this two-part example, students are given clues about properties about the terrestrial and Jovian planets respectively and asked to match up the planet with the correct equatorial radius, mean orbital velocity, and period of rotation.
(Note: this resource was added to OER Commons as part of a batch upload of over 2,200 records. If you notice an issue with the quality of the metadata, please let us know by using the 'report' button and we will flag it for consideration.)
In this lesson, students will learn what erosion is and how human …
In this lesson, students will learn what erosion is and how human actions influence erosion. Includes introduction, demonstration instructions, and questions for wrap-up discussion.
NGSS: 2-ESS2-1
Time: 50 minutes
Materials: plastic containers with sand and gravel, sponges, and plastic cups
Working with data, students develop 3-D understandings of Earth structures using inference …
Working with data, students develop 3-D understandings of Earth structures using inference to construct a block diagram from a collection of 2-D information.
(Note: this resource was added to OER Commons as part of a batch upload of over 2,200 records. If you notice an issue with the quality of the metadata, please let us know by using the 'report' button and we will flag it for consideration.)
This is a work in progress. We make decisions every day in …
This is a work in progress. We make decisions every day in our lives as earth scientists, many of which have ethical implications. In this activity, students apply their growing body of knowledge and skills to a real-world geoscience case, with the opportunity to make explicit the ethical aspects of the scientific work involved, as well as ethical aspects of working with individuals and the greater society, while also exploring their own values and ethics. Making explicit the ethical issues involved in turn leads to practicing ethical decision-making skills in the context of the problem addressed, through small group problem-solving and class discussion. The case presented is a pilot study on metals in urban soils, and takes the students through the thinking processes involved from project set up to end. The case specifically addresses ethical decision-making at the beginning of a pilot project (involving scientific, societal and personal ethical concerns), throughout the project (involving scientific and personal ethical concerns), and in the communication of the results to the public (involving scientific, societal and personal ethical concerns).
(Note: this resource was added to OER Commons as part of a batch upload of over 2,200 records. If you notice an issue with the quality of the metadata, please let us know by using the 'report' button and we will flag it for consideration.)
GIS program allows computation and display of three point problem and contact …
GIS program allows computation and display of three point problem and contact tracing across topopgraphy. It helps students visualize how terrain and stratigraphy interact.
(Note: this resource was added to OER Commons as part of a batch upload of over 2,200 records. If you notice an issue with the quality of the metadata, please let us know by using the 'report' button and we will flag it for consideration.)
No restrictions on your remixing, redistributing, or making derivative works. Give credit to the author, as required.
Your remixing, redistributing, or making derivatives works comes with some restrictions, including how it is shared.
Your redistributing comes with some restrictions. Do not remix or make derivative works.
Most restrictive license type. Prohibits most uses, sharing, and any changes.
Copyrighted materials, available under Fair Use and the TEACH Act for US-based educators, or other custom arrangements. Go to the resource provider to see their individual restrictions.