An exercise assessing the water demand of New York City and population …
An exercise assessing the water demand of New York City and population dynamics underlying that demand is provided. Visualization of first order water resource estimates using precipitation data and a known water storage volume are used to draw conclusions about drought risk and the sustainability of NYC water supplies.
(Note: this resource was added to OER Commons as part of a batch upload of over 2,200 records. If you notice an issue with the quality of the metadata, please let us know by using the 'report' button and we will flag it for consideration.)
This activity introduces students to an actual data set that explores the …
This activity introduces students to an actual data set that explores the impacts of ocean acidification on tropical coral reef ecosystems. Students are first given a scenario for a field site in the Caribbean and are asked to design an experiment that answers the question: How will a decline in surface ocean pH by the 21st century impact tropical coral growth? Students then gather actual data (from coral images collected from the field site) to calculate calcification rates of different coral samples. Finally, students use the provided saturation state values to predict the extent to which coral calcification is expected to decline by the 21st century.
This module introduces students who are already familiar with GIS to doing …
This module introduces students who are already familiar with GIS to doing comparative analyses with large-scale community science (often called citizen science) data sets. Students will explore how we can use community science data to examine the spread and distribution of invasive species in different geographic locations. In the final step, students will identify different invasive species and determine if community science data accurately maps the threat these species pose.
(Note: this resource was added to OER Commons as part of a batch upload of over 2,200 records. If you notice an issue with the quality of the metadata, please let us know by using the 'report' button and we will flag it for consideration.)
Finding themselves in the middle of the Amazon rainforest after a plane …
Finding themselves in the middle of the Amazon rainforest after a plane crash, students use map scales, keys, and longitude and latitude coordinates to figure out where they are. Then they work in groups to generate ideas and make plans. They decide where they should go to be rescued, the distance to that location, the route to take, and make calculations to estimate walking travel time.
Instruction on use of Fisher statistics to determine the mean and 95% …
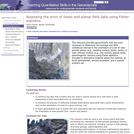
Instruction on use of Fisher statistics to determine the mean and 95% confidence interval of geological vectors, lines or planes, with examples, problems and an Excel spreadsheet for computation.
(Note: this resource was added to OER Commons as part of a batch upload of over 2,200 records. If you notice an issue with the quality of the metadata, please let us know by using the 'report' button and we will flag it for consideration.)
In this homework assignment students are asked to consider the balance of …
In this homework assignment students are asked to consider the balance of forces on a hill slope using the Factor of Safety.
(Note: this resource was added to OER Commons as part of a batch upload of over 2,200 records. If you notice an issue with the quality of the metadata, please let us know by using the 'report' button and we will flag it for consideration.)
This project helps familiarize students with data commonly available from well drillers, …
This project helps familiarize students with data commonly available from well drillers, the Department of Natural Resources and Conservation, and the Montana Bureau of Mines and Geology. Such data is often used to produce consulting reports. In this exercise, students practice working with available data and writing a consulting report while working on a real project of local interest. The question involves the probability of success in drilling a large well for a new county park. Students are given various maps and are guided through the use of a statewide database that contains well logs and well data. The outcome is a written report that describes the location and general geology of the site, uses the available data to summarize the types of materials that a driller might encounter, answers the questions that the client is interested in, and identifies problems or advantages presented by the groundwater system as indicated by available data.
(Note: this resource was added to OER Commons as part of a batch upload of over 2,200 records. If you notice an issue with the quality of the metadata, please let us know by using the 'report' button and we will flag it for consideration.)
Given that humans historically have heavily used rivers and the lands along …
Given that humans historically have heavily used rivers and the lands along them for agriculture, transportation and other activities, how does human impact currently affect riparian ecosystems in a rural region? Students will address this question through several activities.
(Note: this resource was added to OER Commons as part of a batch upload of over 2,200 records. If you notice an issue with the quality of the metadata, please let us know by using the 'report' button and we will flag it for consideration.)
The project is designed to allow students the opportunity to apply the …
The project is designed to allow students the opportunity to apply the knowledge and skills learned during the 'Active Tectonics and Remote Sensing' course. Over the first half of the course, students learn about remote sensing approaches, digital topography, seismicity patterns and geodesy, plus how these can capture various features of the tectonics of an active area. In the project, which runs during the second half of the course, students are asked to bring all available data (available online or in the literature) to bear on a selected continental area, to identify evidence for the tectonic activity that occurs there. Students are asked to highlight this evidence in a Google Earth dataset, which could include image overlays, annotations and markers, to indicate particular features of interest. Examples of highlighted features could include geomorphic features such as deflected or offset drainages, faceted mountain fronts or incised canyons, or linear trends seen in topography, seismicity or vegetation abundance.
The project is assessed via a written report and class presentation, which must refer to the Google Earth dataset. Students are instructed to choose an area located somewhere other than California, to broaden their horizons/address an otherwise California-centric world view.
Keywords: Google Earth, geomorphology, active tectonics
(Note: this resource was added to OER Commons as part of a batch upload of over 2,200 records. If you notice an issue with the quality of the metadata, please let us know by using the 'report' button and we will flag it for consideration.)
First assignment of the course (Note: this resource was added to OER …
First assignment of the course
(Note: this resource was added to OER Commons as part of a batch upload of over 2,200 records. If you notice an issue with the quality of the metadata, please let us know by using the 'report' button and we will flag it for consideration.)
This website has five great astronomy activities! By engaging in these activities, …
This website has five great astronomy activities! By engaging in these activities, you can learn about the Milky Way Galaxy, the Sun, the Big Dipper, and stars!
In this activity, students explore the web-based U.S. Forest Service Climate Change …
In this activity, students explore the web-based U.S. Forest Service Climate Change Atlas to learn about projected climate changes in their state and how suitable habitat for tree and bird species is projected to change by 2100.
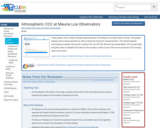
These graphs show carbon dioxide measurements at the Mauna Loa Observatory, Hawaii. …
These graphs show carbon dioxide measurements at the Mauna Loa Observatory, Hawaii. The graphs display recent measurements as well as historical long term measurements. The related website summarizes in graphs the recent monthly CO2, the full CO2 Record, the annual Mean CO2 Growth Rate, and gives links to detailed CO2 data for this location, which is one of the most important CO2 tracking sites in the world.
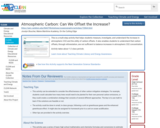
This is a multi-step activity that helps students measure, investigate, and understand …
This is a multi-step activity that helps students measure, investigate, and understand the increase in atmospheric CO2 and the utility of carbon offsets. It also enables students to understand that carbon offsets, through reforestation, are not sufficient to balance increases in atmospheric C02 concentration.
In this feature, adapted from Interactive NOVA: "Earth," students explore the relationship …
In this feature, adapted from Interactive NOVA: "Earth," students explore the relationship between oxygen concentration and the well-being of various organisms by simulating a change in oxygen levels and observing what happens.
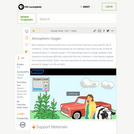
This image depicts a representative subset of the atmospheric processes related to …
This image depicts a representative subset of the atmospheric processes related to aerosol lifecycles, cloud lifecycles, and aerosol-cloud-precipitation interactions that must be understood to improve future climate predictions.
This is a figure from the 2007 IPCC Assessment Report 4 on …
This is a figure from the 2007 IPCC Assessment Report 4 on atmospheric concentrations of carbon dioxide, methane and nitrous oxide over the last 10,000 years (large panels) and since 1750 (inset panels).
Atmospheric methyl chloroform concentration is modeled as an extension of the generic …
Atmospheric methyl chloroform concentration is modeled as an extension of the generic water tank structure. Simulated and observed concentrations are used to estimate the global atmospheric lifetime of methyl chloroform and its 1989 to 2009 emission history.
(Note: this resource was added to OER Commons as part of a batch upload of over 2,200 records. If you notice an issue with the quality of the metadata, please let us know by using the 'report' button and we will flag it for consideration.)
This video shows where and how ice cores are extracted from the …
This video shows where and how ice cores are extracted from the West Antarctic Ice Sheet. The cores are cut, packaged, flown to the ice core storage facility in Denver, further sliced into samples, and shipped to labs all over the world where scientists use them to study indicators of climate change from the past.
No restrictions on your remixing, redistributing, or making derivative works. Give credit to the author, as required.
Your remixing, redistributing, or making derivatives works comes with some restrictions, including how it is shared.
Your redistributing comes with some restrictions. Do not remix or make derivative works.
Most restrictive license type. Prohibits most uses, sharing, and any changes.
Copyrighted materials, available under Fair Use and the TEACH Act for US-based educators, or other custom arrangements. Go to the resource provider to see their individual restrictions.