Students will explore Asian American and Pacific Islander (“AAPI”) women’s poetry in …
Students will explore Asian American and Pacific Islander (“AAPI”) women’s poetry in order to craft and inspire their own poetry, studying central idea and six different poetic elements over the course of the unit. After analyzing and interpreting poems, students will recognize poetry as a vehicle to express untold stories about events small and large. Students will learn about the experiences of and challenges faced by AAPI women, including topics of retaining culture, climate change, and more.
2021 Social Science Standards Integrated with Ethnic Studies: Civics and Government: 5.1, 7.5 Economics: 4.4 Historical Knowledge: 5.22 Social Science Analysis: 3.19, 4.21, 4.24, 5.26, 52.27, 6.26, 7.28, 7.29
Using Landsat 8 imagery from before and after the 2015 wildfire season …
Using Landsat 8 imagery from before and after the 2015 wildfire season in Glacier National Park, Montana, learners calculate the damage using a Normalized Burn Index, digitize the burn area, and publish to ArcGIS Online.
Stakeholders of the Morro Bay National Estuary Program in California worked with …
Stakeholders of the Morro Bay National Estuary Program in California worked with resources from the EPA's Climate Ready Estuaries program to identify their climate risks. Their results helped them prioritize actions for building resilience.
This easy-to-understand video animation describes drought and explains the different categories of …
This easy-to-understand video animation describes drought and explains the different categories of drought used by the drought monitor. It discusses the effects of and contributions to drought, what the implications of the different drought levels are, and puts the drought maps into context to understand how the impacts vary geographically (e.g. drought in Nevada vs Kansas - one could affect tourism, the other agriculture). It also touches on how the development of maps/drought severity is determined and how it might vary geographically. The animation provides a basic overview of statistics and percentiles and the concept of '100 year events.'
Students will read primary scientific literature, work collaboratively, think critically, and utilize …
Students will read primary scientific literature, work collaboratively, think critically, and utilize GIS as a tool to visualize and quantify spatial and temporal changes in hydrological systems.
(Note: this resource was added to OER Commons as part of a batch upload of over 2,200 records. If you notice an issue with the quality of the metadata, please let us know by using the 'report' button and we will flag it for consideration.)
This activity introduces students to an actual data set that explores the …
This activity introduces students to an actual data set that explores the impacts of ocean acidification on tropical coral reef ecosystems. Students are first given a scenario for a field site in the Caribbean and are asked to design an experiment that answers the question: How will a decline in surface ocean pH by the 21st century impact tropical coral growth? Students then gather actual data (from coral images collected from the field site) to calculate calcification rates of different coral samples. Finally, students use the provided saturation state values to predict the extent to which coral calcification is expected to decline by the 21st century.
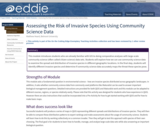
This module introduces students who are already familiar with GIS to doing …
This module introduces students who are already familiar with GIS to doing comparative analyses with large-scale community science (often called citizen science) data sets. Students will explore how we can use community science data to examine the spread and distribution of invasive species in different geographic locations. In the final step, students will identify different invasive species and determine if community science data accurately maps the threat these species pose.
(Note: this resource was added to OER Commons as part of a batch upload of over 2,200 records. If you notice an issue with the quality of the metadata, please let us know by using the 'report' button and we will flag it for consideration.)
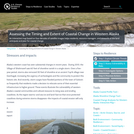
An interactive map based on four decades of satellite images helps residents, …
An interactive map based on four decades of satellite images helps residents, resource managers, and stewards of the land anticipate and plan for coastal change.
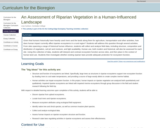
Given that humans historically have heavily used rivers and the lands along …
Given that humans historically have heavily used rivers and the lands along them for agriculture, transportation and other activities, how does human impact currently affect riparian ecosystems in a rural region? Students will address this question through several activities.
(Note: this resource was added to OER Commons as part of a batch upload of over 2,200 records. If you notice an issue with the quality of the metadata, please let us know by using the 'report' button and we will flag it for consideration.)
Astronomy Notes is a website with a brief overview of astronomy's place …
Astronomy Notes is a website with a brief overview of astronomy's place in the scientific endeavor, the philosophy of science and the scientific method, astronomy that can be done without a telescope, a history of astronomy and science, Newton's law of gravity and applications to orbits, Einstein's Relativity theories, electromagnetic radiation, telescopes, all the objects of the solar system, solar system formation, determining properties of the stars, the Sun, fusion reactions, stellar structure, stellar evolution, the interstellar medium, the structure of the Milky Way galaxy, extra-galactic astronomy including active galaxies and quasars, cosmology, and extra-terrestrial life. This site also has pages giving angular momentum examples, a quick mathematics review, improving study skills, astronomy tables, and astronomy terms
This course provides a graduate-level introduction to stellar astrophysics. It covers a …
This course provides a graduate-level introduction to stellar astrophysics. It covers a variety of topics, ranging from stellar structure and evolution to galactic dynamics and dark matter.
In this activity, students explore the web-based U.S. Forest Service Climate Change …
In this activity, students explore the web-based U.S. Forest Service Climate Change Atlas to learn about projected climate changes in their state and how suitable habitat for tree and bird species is projected to change by 2100.
These graphs show carbon dioxide measurements at the Mauna Loa Observatory, Hawaii. …
These graphs show carbon dioxide measurements at the Mauna Loa Observatory, Hawaii. The graphs display recent measurements as well as historical long term measurements. The related website summarizes in graphs the recent monthly CO2, the full CO2 Record, the annual Mean CO2 Growth Rate, and gives links to detailed CO2 data for this location, which is one of the most important CO2 tracking sites in the world.
This is a multi-step activity that helps students measure, investigate, and understand …
This is a multi-step activity that helps students measure, investigate, and understand the increase in atmospheric CO2 and the utility of carbon offsets. It also enables students to understand that carbon offsets, through reforestation, are not sufficient to balance increases in atmospheric C02 concentration.
This course provides a detailed overview of the chemical transformations that control …
This course provides a detailed overview of the chemical transformations that control the abundances of key trace species in the Earth's atmosphere. Emphasizes the effects of human activity on air quality and climate. Topics include photochemistry, kinetics, and thermodynamics important to the chemistry of the atmosphere; stratospheric ozone depletion; oxidation chemistry of the troposphere; photochemical smog; aerosol chemistry; and sources and sinks of greenhouse gases and other climate forcers.
This is a figure from the 2007 IPCC Assessment Report 4 on …
This is a figure from the 2007 IPCC Assessment Report 4 on atmospheric concentrations of carbon dioxide, methane and nitrous oxide over the last 10,000 years (large panels) and since 1750 (inset panels).
This is a photo essay linked to a New York Times story …
This is a photo essay linked to a New York Times story about climate-related stressors on forests -- including mountain pine beetles, forest fires, forest clearance, and ice storms -- and the importance of protecting forests as an important carbon sink.
This video shows where and how ice cores are extracted from the …
This video shows where and how ice cores are extracted from the West Antarctic Ice Sheet. The cores are cut, packaged, flown to the ice core storage facility in Denver, further sliced into samples, and shipped to labs all over the world where scientists use them to study indicators of climate change from the past.
The goal of this module is to explore some of the factors …
The goal of this module is to explore some of the factors that might be associated with an individual's level of concern about the environment and global warming. Crosstabulations, frequency distributions, and bar charts will be used.
No restrictions on your remixing, redistributing, or making derivative works. Give credit to the author, as required.
Your remixing, redistributing, or making derivatives works comes with some restrictions, including how it is shared.
Your redistributing comes with some restrictions. Do not remix or make derivative works.
Most restrictive license type. Prohibits most uses, sharing, and any changes.
Copyrighted materials, available under Fair Use and the TEACH Act for US-based educators, or other custom arrangements. Go to the resource provider to see their individual restrictions.