The purpose of this unit is to explore, compare, contrast, and calculate …
The purpose of this unit is to explore, compare, contrast, and calculate energy fluxes from different CZO field sites to better appreciate the critical differences in the driving radiative forces affecting each site. This module will help students complete their semester-long project by introducing them to critical baseline data collection and databases related to energy budgets. The primary data set for this activity is the CZO tower network of a dozen met/flux towers spanning six different biomes/sites. Each site has a slightly different data format but it is easily manipulated in a spreadsheet. The lesson is divided into the following engaging activities:
Background lecture: Introduction to water and energy fluxes and balances Database access and graphing activity: Students will learn what data exists in the CZO database and how to load and manipulate it using Excel. Discovery activity: Students in small groups will compare monthly bar graphs of energy fluxes drawn from six Ameriflux sites and address questions concerning linkages with other variables and processes affecting energy partitioning. Reference ET Activity: Students will learn about the Penman-Monteith formulation of evaporation and calculate this from common meteorological data and compare with field measurements of evapotranspiration. The class will discuss these results as time allows.
(Note: this resource was added to OER Commons as part of a batch upload of over 2,200 records. If you notice an issue with the quality of the metadata, please let us know by using the 'report' button and we will flag it for consideration.)
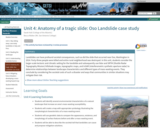
Landslides can have profound societal consequences, such as did the slide that …
Landslides can have profound societal consequences, such as did the slide that occurred near Oso, Washington in 2014. Forty-three people were killed and entire rural neighborhood was destroyed. In this unit, students consider the larger-scale tectonic and climatic setting for the landslide and subsequently use lidar and SRTM (Shuttle Radar Topography Mission) hillshade images, topographic maps, and InSAR (interferometric synthetic aperture radar) to determine relationships between landscape characteristics and different types of mass-wasting events. They conclude by considering the societal costs of such a disaster and ways that communities in similar situations may mitigate their risk.
Show more about Online Teaching suggestions Hide Online-adaptable: The exercises in unit are completely digital and thus at a logistical level it can be switched to online fairly easily. However, due to the relative complexity of the data investigations and group discussions, there will still be a fair bit of instructor support needed and/or extended small group that should be arranged.
(Note: this resource was added to OER Commons as part of a batch upload of over 2,200 records. If you notice an issue with the quality of the metadata, please let us know by using the 'report' button and we will flag it for consideration.)
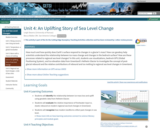
How much and how quickly does Earth's surface respond to changes in …
How much and how quickly does Earth's surface respond to changes in a glacier's mass? How can geodesy help scientists understand the relationship between ice mass change and changes in the bedrock surface? How are these processes related to regional sea level changes? In this unit, students use visualizations, bedrock GPS (Global Positioning System), and ice elevation data from Greenland's Helheim Glacier to investigate the concept of post-glacial rebound and the relative contributions of rebound and ice melting to regional sea level changes in Greenland.
Show more information on GPS versus GNSS Hide Note: Although the term GPS (Global Positioning System) is more commonly used in everyday language, it officially refers only to the USA's constellation of satellites. GNSS (Global Navigation Satellite System) is a universal term that refers to all satellite navigation systems including those from the USA (GPS), Russia (GLONASS), European Union (Galileo), China (BeiDou), and others. In this module, we use the term GPS even though, technically, some of the data may be coming from satellites in other systems.
Show more about Online Teaching suggestions Hide Online-adaptable: The lecture and main data analysis exercise can easily be moved online. The final piece is a discussion or [linkhttps://serc.carleton.edu/introgeo/gallerywalk/index.html 'gallery walk'] which can also be successfully done online but may take a little more preparation. For instance, in the case of the gallery walk, the images and questions can be available for online viewing with space available for student comments. Online groups then rotate through the stations virtually.
(Note: this resource was added to OER Commons as part of a batch upload of over 2,200 records. If you notice an issue with the quality of the metadata, please let us know by using the 'report' button and we will flag it for consideration.)
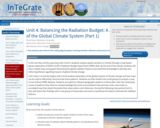
In this two-day activity spanning Units 4 and 5, students analyze spatial …
In this two-day activity spanning Units 4 and 5, students analyze spatial variation in climate through a map-based jigsaw exploration of NASA's Earth's Radiation Budget Experiment (ERBE) data. By the end of the activity, students will have created maps and graphs illustrating the global radiation balance and used their knowledge to develop and refine hypotheses regarding impacts of global climate change.
Unit 4 (day 1 of activity) begins with a brief student exploration of the global impacts of climate change and how maps can be used to effectively communicate these patterns. Students are then broken into small groups to analyze a map of one of three ERBE datasets. Students are asked to interpret geographic patterns in these data, infer the underlying causes of patterns they observe using knowledge they have accumulated in the previous units, and create an annotated map that clearly illustrates their observations and inferences. During the following class period (Unit 5), they will share their findings with a new group of classmates and work to synthesize the data to estimate the radiation balance.
(Note: this resource was added to OER Commons as part of a batch upload of over 2,200 records. If you notice an issue with the quality of the metadata, please let us know by using the 'report' button and we will flag it for consideration.)
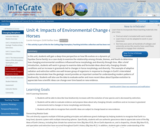
In this unit, students will gain a deep-time perspective on how life …
In this unit, students will gain a deep-time perspective on how life evolves on a dynamic planet. They will use the Equidae (horse family) as a case study to examine the relationship among climate, biomes, and fossils to determine how changing environmental conditions influenced horse morphology and diversity through time. After a brief introduction, students will work in groups to examine data and formulate ideas about why changing climatic conditions and an increase in grasslands led to changes in horse morphology and diversity. This example of adaptive radiation and extinction within one well-known group of organisms in response to changes in Earth's interrelated systems demonstrates how the geologic record provides an important context for understanding modern patterns of biodiversity. Students will also use the data to evaluate earlier and more recent ideas about Equidae evolution to appreciate how scientific ideas can change over time based on new evidence.
(Note: this resource was added to OER Commons as part of a batch upload of over 2,200 records. If you notice an issue with the quality of the metadata, please let us know by using the 'report' button and we will flag it for consideration.)
This unit shows how GPS records of bedrock surface elevation may be …
This unit shows how GPS records of bedrock surface elevation may be used to monitor snow and ice loading/unloading on decadal and annual time scales. Students calculate secular trends in the GPS time series and then use the original and detrended records to identify sites that exhibit similar behavior. Students gain experience with the challenges and benefits of using bedrock geodetic data to study snow and ice mass changes. They also consider the magnitude and timing of the elastic component of vertical change compared to that associated with post-glacial rebound (viscoelastic response).
Show more information on GPS versus GNSS Hide Note: Although the term GPS (Global Positioning System) is more commonly used in everyday language, it officially refers only to the USA's constellation of satellites. GNSS (Global Navigation Satellite System) is a universal term that refers to all satellite navigation systems including those from the USA (GPS), Russia (GLONASS), European Union (Galileo), China (BeiDou), and others. In this module, we use the term GPS even though, technically, some of the data may be coming from satellites in other systems.
Show more about Online Teaching suggestions Hide Online-ready: The exercise is electronic and could be done individually or in small online groups. Lecture is best done synchronously due to the technical nature. Discussion would be better that way too.
(Note: this resource was added to OER Commons as part of a batch upload of over 2,200 records. If you notice an issue with the quality of the metadata, please let us know by using the 'report' button and we will flag it for consideration.)
Students will read and summarize an article that details scientific studies on …
Students will read and summarize an article that details scientific studies on behavioral changes of gray whales. Discussed are their feeding behavior, migratory behavior, and breeding patterns in the Pacific. Students will examine the whales' responses and discuss in small groups how the responses relate to climate change. By interpreting potential links between gray whale behavior and changed ocean conditions, students will be able to infer the ecological role that gray whales play within a community and an ecosystem. Students will summarize the main concepts, scientific evidence, data and observations cited, and justify why gray whales can be considered "ecosystem sentinels."
(Note: this resource was added to OER Commons as part of a batch upload of over 2,200 records. If you notice an issue with the quality of the metadata, please let us know by using the 'report' button and we will flag it for consideration.)
Building on the work they did in Unit 3, students will perform …
Building on the work they did in Unit 3, students will perform an "ecocritical" rhetorical reading (the theoretical lens for examining the way that literary texts engage with climate and climate issues) in order to analyze a short story chosen from several provided by the instructor. They will utilize literary terminology in discussing this text and generating a rhetorical analysis of it.
(Note: this resource was added to OER Commons as part of a batch upload of over 2,200 records. If you notice an issue with the quality of the metadata, please let us know by using the 'report' button and we will flag it for consideration.)
The California Drought of 2012 -- 2016 had significant social and economic …
The California Drought of 2012 -- 2016 had significant social and economic consequences. This final unit focuses on this drought as a case study for measuring the hydrologic system so that we can better understand fluxes, variability, uncertainties, and methods to measure them. Students analyze a variety of data that are relevant to basin-scale water budget: precipitation, terrestrial water storage, and snow pack. Traditional monitoring systems used are precipitation and snow pillow sensors. The newer geodetic methods are GRACE (Gravity Recovery and Climate Experiment satellite) and Reflection GPS. The students then use these data to consider water storage changes during the drought and how these changes compare in magnitude to human consumption. The work can start during a lab period and carry over into work outside of the lab time. The student exercise takes the form of responses to questions and tasks that tests a student's abilities to synthesize information and identify challenges in monitoring the terrestrial water cycle. Students then take the step-by-step exercise results and synthesize it into a report for California water policy makers to highlight the findings and pro/cons/uncertainties for the different methods. Unit 4 is the summative assessment for the module.
Show more information on GPS versus GNSS Hide Note: Although the term GPS (Global Positioning System) is more commonly used in everyday language, it officially refers only to the USA's constellation of satellites. GNSS (Global Navigation Satellite System) is a universal term that refers to all satellite navigation systems including those from the USA (GPS), Russia (GLONASS), European Union (Galileo), China (BeiDou), and others. In this module, we use the term GPS even though, technically, some of the data may be coming from satellites in other systems.
Show more about Online Teaching suggestions Hide Online-ready: The exercise is electronic and could be done individually or in small online groups. Lecture is best done synchronously due to the technical nature.
(Note: this resource was added to OER Commons as part of a batch upload of over 2,200 records. If you notice an issue with the quality of the metadata, please let us know by using the 'report' button and we will flag it for consideration.)
In this two-day activity spanning Units 4 and 5, students analyze spatial …
In this two-day activity spanning Units 4 and 5, students analyze spatial variation in climate through a map-based jigsaw exploration of NASA's Earth's Radiation Budget Experiment (ERBE) data. By the end of the activity students will have created maps and graphs illustrating the global radiation balance and used their knowledge to develop and refine hypotheses regarding impacts of global climate change.
In Unit 5 (day 2 of activity) students work in new groups that include members who analyzed each of the three ERBE datasets from day 1 of the activity (Unit 4). These synthesis groups work together to summarize their observations and infer regions of radiation excess and deficit in graph and map forms. These new figures are used to facilitate a whole-class discussion of the global radiation balance. The unit ends with a discussion of how atmospheric circulation acts to balance the radiation budget and the impacts of a changing climate on other Earth systems.
(Note: this resource was added to OER Commons as part of a batch upload of over 2,200 records. If you notice an issue with the quality of the metadata, please let us know by using the 'report' button and we will flag it for consideration.)
Most often, we characterize floods based on their return periods. Considering new …
Most often, we characterize floods based on their return periods. Considering new land developments and the changing climate, what was once a 100-year flood may change over time. Thus, if we are going to experience the previously defined 100-year flood more frequently, the new 100-year flood may be what was a 500-year flood before. One may then wonder what will be the impact of this 500-year flood compared to a 100-year flood? Is it five times bigger and more damaging than a 100-year flood? The goal of this Unit 5 is to let students quantify floods for 100 and 500 year return periods, and map the corresponding flood inundation extents. The students will then use these results to see how the flood magnitude and the inundation area changes for these floods. The final inundation maps can also be used to estimate key infrastructure that may be vulnerable. This unit serves as the Summative Assessment for the module. Data sets are provided for students to apply concepts learned in prior units to a new scenario. As with Unit 4, this unit uses HEC-RAS. It can be done by students largely outside of class time.
(Note: this resource was added to OER Commons as part of a batch upload of over 2,200 records. If you notice an issue with the quality of the metadata, please let us know by using the 'report' button and we will flag it for consideration.)
Students will examine data that record the modern increase in carbon dioxide …
Students will examine data that record the modern increase in carbon dioxide concentrations and the associated increase in average temperatures, and they will investigate the effects of carbon dioxide on various components of the Earth system (atmosphere, cryosphere, hydrosphere -- oceans). Students also learn how the burning of fossil fuels contributes to increases in atmospheric carbon dioxide.
(Note: this resource was added to OER Commons as part of a batch upload of over 2,200 records. If you notice an issue with the quality of the metadata, please let us know by using the 'report' button and we will flag it for consideration.)
Students will investigate how the factors that influence erosion work together to …
Students will investigate how the factors that influence erosion work together to produce an overall erosion rate. In agricultural areas, these factors are rainfall-runoff erosivity, soil erodibility, slope characteristics, and agricultural practices. Students will analyze changes in precipitation predicted by climate change models to consider how a changing climate could influence erosion rates in agricultural areas.
(Note: this resource was added to OER Commons as part of a batch upload of over 2,200 records. If you notice an issue with the quality of the metadata, please let us know by using the 'report' button and we will flag it for consideration.)
Is sea level change globally uniform? How do sea level changes have …
Is sea level change globally uniform? How do sea level changes have the potential to influence major metropolitan areas during the next century? How should these changes be addressed, and who should be responsible for taking action? In this unit, the conclusion to the Ice Mass and Sea Level Change module, students explore the potential impacts of sea level change on the economy, infrastructure, and residents of Southern California and New York City. Students also consider how changes in these two regions will have a widespread influence on other US cities, even for landlocked communities.
Show more about Online Teaching suggestions Hide Online-adaptable: This sea level impact analysis is designed to be done in small groups and possibly with a class gallery walk. These would need to be converted to small online groups and online discussion. The Part 4 wall walk could potentially be adapted to class discussion that uses polling feature to see people's opinions. Arguments could be made verbally or with the chat box.
(Note: this resource was added to OER Commons as part of a batch upload of over 2,200 records. If you notice an issue with the quality of the metadata, please let us know by using the 'report' button and we will flag it for consideration.)
Sea-level rise due to the melting of glaciers and ice sheets and …
Sea-level rise due to the melting of glaciers and ice sheets and ocean thermal expansion has significant societal and economic consequences. In this final unit, students prepare a summary of the impacts of sea level for relevant stakeholders. Students will integrate the stakeholder analysis in Unit 1 with the geodetic data (radar satellite altimetry, GRACE [Gravity Recovery and Climate Experiment], InSAR, and GPS) of ice mass loss and sea-level rise from Units 2 -- 4 in their analysis. Unit 5 is the summative assessment for the module.
Show more about Online Teaching suggestions Hide Online-ready: The exercise is a final project that can be done remotely, individually or in small online groups.
(Note: this resource was added to OER Commons as part of a batch upload of over 2,200 records. If you notice an issue with the quality of the metadata, please let us know by using the 'report' button and we will flag it for consideration.)
In the final unit of the module, students will synthesize their understanding …
In the final unit of the module, students will synthesize their understanding of climate science and modes of communication. Students are assigned to groups and given a climate change issue that they will use to demonstrate their understanding of ethos, pathos, and logos, when presented with a variety of audiences. The module summative assessment is designed to be administered after this unit.
(Note: this resource was added to OER Commons as part of a batch upload of over 2,200 records. If you notice an issue with the quality of the metadata, please let us know by using the 'report' button and we will flag it for consideration.)
This unit is the module's capstone project: developing a conceptual model of …
This unit is the module's capstone project: developing a conceptual model of the climatic and societal effects of a catastrophic volcanic eruption occurring in modern times. Through independent research and in-class collaboration, students explore the climatic and societal effects of past volcanic eruption events. Students are then introduced to the large Toba eruption event, review concept maps, concept sketches, and system diagrams, and are are given examples and guidelines for conceptual model design. Students complete their written summary outside of class.
(Note: this resource was added to OER Commons as part of a batch upload of over 2,200 records. If you notice an issue with the quality of the metadata, please let us know by using the 'report' button and we will flag it for consideration.)
For a given region, students will use what they have learned about …
For a given region, students will use what they have learned about the interdisciplinary problem of soil sustainability to make recommendations for agricultural practices in response to potential changes in climate. Students will present their findings in a fact sheet that describes best practices for mitigating potential changes while remaining sensitive to stakeholder concerns and feasibility. Finally, students will complete a final personal reflection on their own learning.
(Note: this resource was added to OER Commons as part of a batch upload of over 2,200 records. If you notice an issue with the quality of the metadata, please let us know by using the 'report' button and we will flag it for consideration.)
In this unit, students will review mock proposals that deal with some …
In this unit, students will review mock proposals that deal with some aspect of the role of carbon in the environment. Each proposal is based on actual actions proposed to mitigate some aspect of carbon consumption and/or climate change, and as such are considered "real world" scenarios (although somewhat generalized for this exercise). Students will review each proposal for the possible societal, economic, and moral implications if the proposal was pursued on a large scale -- for instance, by a single nation or collection of countries. Additionally, students will make recommendations to a fictitious governmental panel on the merits and pitfalls of each proposal and provide well-supported recommendations about whether that government panel should pursue or reject the proposal. Instructors can use this unit as a stand-alone activity, or as a summary activity to comprehensively review, discuss, and assess material presented in this module's earlier units.
(Note: this resource was added to OER Commons as part of a batch upload of over 2,200 records. If you notice an issue with the quality of the metadata, please let us know by using the 'report' button and we will flag it for consideration.)
Students are introduced to the concept of geoengineering, "the deliberate large-scale intervention …
Students are introduced to the concept of geoengineering, "the deliberate large-scale intervention in the Earth's climate system, in order to moderate global warming" (The Royal Society). The goal is for them to leverage their acquired knowledge from previous units in physical oceanography, ocean chemistry, biodiversity, and ecosystem ecology to evaluate the validity and/or the risk of geoengineering (systems thinking). Current and future generations will be required to make informed decisions on whether they support strategies that result in irreversible changes in Earth's carbon cycle.
(Note: this resource was added to OER Commons as part of a batch upload of over 2,200 records. If you notice an issue with the quality of the metadata, please let us know by using the 'report' button and we will flag it for consideration.)
No restrictions on your remixing, redistributing, or making derivative works. Give credit to the author, as required.
Your remixing, redistributing, or making derivatives works comes with some restrictions, including how it is shared.
Your redistributing comes with some restrictions. Do not remix or make derivative works.
Most restrictive license type. Prohibits most uses, sharing, and any changes.
Copyrighted materials, available under Fair Use and the TEACH Act for US-based educators, or other custom arrangements. Go to the resource provider to see their individual restrictions.