The goal of this virtual field trip to Iridium Hill, Montana is …
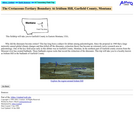
The goal of this virtual field trip to Iridium Hill, Montana is to investigate the disappearance of dinosaur fossils above the Cretaceous/ Tertiary boundary. The site provides rock outcrop photos of Cretaceous and Tertiary strata (Hell Creek and Fort Union Formations), stratigraphic sections and supporting text for this classic iridium-bearing locality. Topics include the K/T boundary, iridium concentrations, stratigraphy, sedimentology and, fluvial and lacustrine depositional environments.
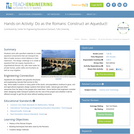
Students learn how the force of water helps determine the size and …
Students learn how the force of water helps determine the size and shape of dams. They use clay to build models of four types of dams, and observe the force of the water against each type. They conclude by deciding which type of dam they, as Splash Engineering engineers, will design for Thirsty County.
While the creation of a dam provides many benefits, it can have …
While the creation of a dam provides many benefits, it can have negative impacts on local ecosystems. Students learn about the major environmental impacts of dams and the engineering solutions used to address them.
Through eight lessons, students are introduced to many facets of dams, including …
Through eight lessons, students are introduced to many facets of dams, including their basic components, the common types (all designed to resist strong forces), their primary benefits (electricity generation, water supply, flood control, irrigation, recreation), and their importance (historically, currently and globally). Through an introduction to kinetic and potential energy, students come to understand how dams generate electricity. They learn about the structure, function and purpose of locks, which involves an introduction to Pascal's law, water pressure and gravity. Other lessons introduce students to common environmental impacts of dams and the engineering approaches to address them. They learn about the life cycle of salmon and the many engineered dam structures that aid in their river passage, as they think of their own methods and devices that could help fish migrate past dams. Students learn how dams and reservoirs become part of the Earth's hydrologic cycle, focusing on the role of evaporation. To conclude, students learn that dams do not last forever; they require ongoing maintenance, occasionally fail or succumb to "old age," or are no longer needed, and are sometimes removed. Through associated hands-on activities, students track their personal water usage; use clay and plastic containers to model and test four types of dam structures; use paper cups and water to learn about water pressure and Pascal's Law; explore kinetic energy by creating their own experimental waterwheel from two-liter plastic bottles; collect and count a stream's insects to gauge its health; play an animated PowerPoint game to quiz their understanding of the salmon life cycle and fish ladders; run a weeklong experiment to measure water evaporation and graph their data; and research eight dams to find out and compare their original purposes, current status, reservoir capacity and lifespan. Woven throughout the unit is a continuing hypothetical scenario in which students act as consulting engineers with a Splash Engineering firm, assisting Thirsty County in designing a dam for Birdseye River.
Student must synthesize the data that go into the construction and operation …
Student must synthesize the data that go into the construction and operation of a large hydroelectric dam. Students must strive to develop a design that minimizes or mitigates the impacts of the dam on the existing watershed. Students divide the analysis and frequently present to each other their findings. These findings are then synthesized into independent reports produced by each student. Designed for a geomorphology course Uses online and/or real-time data Uses geomorphology to solve problems in other fields Addresses student misconceptions
(Note: this resource was added to OER Commons as part of a batch upload of over 2,200 records. If you notice an issue with the quality of the metadata, please let us know by using the 'report' button and we will flag it for consideration.)
This exercise begins with a demonstration of fluid flow through porous sediment …
This exercise begins with a demonstration of fluid flow through porous sediment using a constant head permeameter, with the students conducting the experiment and collecting the data. The demo is followed by a Think-Pair-Share exercise in which the question is posed to the class: "What could we change in order to increase flow through the system?" The class then works through their brainstormed list of ideas, discussing each and evaluating whether it is correct or a misconception. The students derive Darcy's Law qualitatively, based upon the results of the Think-Pair-Share exercise and discussions.
(Note: this resource was added to OER Commons as part of a batch upload of over 2,200 records. If you notice an issue with the quality of the metadata, please let us know by using the 'report' button and we will flag it for consideration.)
In this activity the students calculate recurrence intervals for some historical crests …
In this activity the students calculate recurrence intervals for some historical crests on the Chippewa River and identify the 100-year flood plain in downtown Eau Claire. The students also evaluate the effect of a 20ft high stage event along the whole Chippewa River with the goal of showing how topography influences the size of the area affected by flooding events. The students also evaluate the effectiveness of a flood gate system located on campus.
(Note: this resource was added to OER Commons as part of a batch upload of over 2,200 records. If you notice an issue with the quality of the metadata, please let us know by using the 'report' button and we will flag it for consideration.)
This activity is a two-part (three week) lab in which students initially …
This activity is a two-part (three week) lab in which students initially develop a claim (non-scientific) and learn how to use evidence to support a claim. They then are provided with a scientific research question for which they need to make a claim supported with evidence from their own models (river/stream tables). Based on their results, they then ask a new research question, design the model, carry out their tests and report their results.
(Note: this resource was added to OER Commons as part of a batch upload of over 2,200 records. If you notice an issue with the quality of the metadata, please let us know by using the 'report' button and we will flag it for consideration.)
It's not easy to keep faucets flowing year-round in southwest Florida. To …
It's not easy to keep faucets flowing year-round in southwest Florida. To make sure their customers can get ample clean water at a good priceeven through dry seasonswater utility managers crafted a useful index to help them decide which water sources to use.
Some of the Viking images sent back from Mars in the 1970s …
Some of the Viking images sent back from Mars in the 1970s show tantalizing evidence of dendritic valley networks in some of the oldest terrains on the planet. One of the big questions ever since has been whether it might have rained early in Mars history.
One of the ways of deciding whether the Mars valley networks might have been produced by rainfall is to find out how similar they are to valley networks on Earth, which we know are produced by rainfall. The standard method for analyzing drainage basins is comparison of the number of drainage segments per square kilometer (drainage density) and how extensively branched the network is (stream order).
In this exercise, students calculate stream order for valley segments mapped by Hynek and Phillips (2003) using MOC/MOLA data. Students then use data on valley segment length and drainage basin area from Hynek and Phillips (2003) to calculate drainage density. They compare stream order and drainage density for the Mars site with similar calculations for areas on Earth and evaluate the question of whether valley networks on Mars might be consistent with rainfall on an early Mars, and what the uncertainties and limitations are in their conclusions.
(Note: this resource was added to OER Commons as part of a batch upload of over 2,200 records. If you notice an issue with the quality of the metadata, please let us know by using the 'report' button and we will flag it for consideration.)
In this quantitative field activity, students collect field data on channel geometry, …
In this quantitative field activity, students collect field data on channel geometry, flow velocity, and bed materials. Using these data, they apply flow resistance equations and sediment transport relations to estimate the bankfull discharge and to determine if the flow is sufficient to mobilize the bed.
(Note: this resource was added to OER Commons as part of a batch upload of over 2,200 records. If you notice an issue with the quality of the metadata, please let us know by using the 'report' button and we will flag it for consideration.)
I find that when assigning lengthy readings for in-class discussion, it is …
I find that when assigning lengthy readings for in-class discussion, it is extremely helpful to guide students' preparation with specific questions, and incorporate these in worksheets that explicitly call for students to write out their responses before entering the classroom. These worksheets can provide some added structure for whole-class discussion, or can provide a specific agenda for review of the readings in small groups. Because these readings are more than a few years old, I have also found it useful to assign small groups of students to give brief reports that expand on and update the issues raised in the readings.
(Note: this resource was added to OER Commons as part of a batch upload of over 2,200 records. If you notice an issue with the quality of the metadata, please let us know by using the 'report' button and we will flag it for consideration.)
Students work with specified materials to create aqueduct components that can transport …
Students work with specified materials to create aqueduct components that can transport two liters of water across a short distance in their classroom. The design challenge is to create an aqueduct that can supply Aqueductis, a (hypothetical) Roman city, with clean water for private homes, public baths and fountains as well as crop irrigation.
Students gain a basic understanding of the properties of media soil, sand, …
Students gain a basic understanding of the properties of media soil, sand, compost, gravel and how these materials affect the movement of water (infiltration/percolation) into and below the surface of the ground. They learn about permeability, porosity, particle size, surface area, capillary action, storage capacity and field capacity, and how the characteristics of the materials that compose the media layer ultimately affect the recharging of groundwater tables. They test each type of material, determining storage capacity, field capacity and infiltration rates, seeing the effect of media size on infiltration rate and storage. Then teams apply the testing results to the design their own material mixes that best meet the design requirements. To conclude, they talk about how engineers apply what students learned in the activity about the infiltration rates of different soil materials to the design of stormwater management systems.
This is an in-class activity analyzing our drinking water reservoir, but would …
This is an in-class activity analyzing our drinking water reservoir, but would apply to any reservoir for which there are basic crest/elevation data and maps available.
(Note: this resource was added to OER Commons as part of a batch upload of over 2,200 records. If you notice an issue with the quality of the metadata, please let us know by using the 'report' button and we will flag it for consideration.)
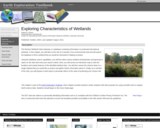
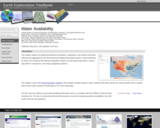
DATA: Worldwide Wetlands Inventory. TOOL: Ramsar International Wetlands Data Gateway. SUMMARY: Learn …
DATA: Worldwide Wetlands Inventory. TOOL: Ramsar International Wetlands Data Gateway. SUMMARY: Learn about wetlands around the world. Perform a series of searches to identify wetland areas that need protection.
(Note: this resource was added to OER Commons as part of a batch upload of over 2,200 records. If you notice an issue with the quality of the metadata, please let us know by using the 'report' button and we will flag it for consideration.)
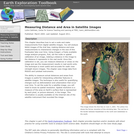
DATA: MODIS Imagery. TOOL: ImageJ. SUMMARY: Examine images of the Aral Sea …
DATA: MODIS Imagery. TOOL: ImageJ. SUMMARY: Examine images of the Aral Sea from 1973 through 2003. Use image analysis software to measure changes in the width and area of the freshwater lake over time.
(Note: this resource was added to OER Commons as part of a batch upload of over 2,200 records. If you notice an issue with the quality of the metadata, please let us know by using the 'report' button and we will flag it for consideration.)
DATA: North American Regional Reanalysis (NARR). TOOL: FieldScope GIS. SUMMARY: Use an …
DATA: North American Regional Reanalysis (NARR). TOOL: FieldScope GIS. SUMMARY: Use an online GIS from the National Geographic Society, to investigate the relationship between precipitation, evaporation, and surface runoff.
(Note: this resource was added to OER Commons as part of a batch upload of over 2,200 records. If you notice an issue with the quality of the metadata, please let us know by using the 'report' button and we will flag it for consideration.)
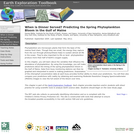
DATA: Ocean Buoy Data, MODIS Images TOOLS: GoMOOS Online Graphing Tool SUMMARY: Learn about conditions that influence the spring phytoplankton bloom. Use an online graphing tool to predict the date of the bloom.
(Note: this resource was added to OER Commons as part of a batch upload of over 2,200 records. If you notice an issue with the quality of the metadata, please let us know by using the 'report' button and we will flag it for consideration.)
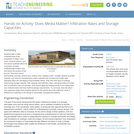
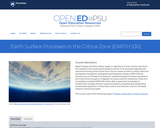
Rapid changes at Earth's surface, largely in response to human activity, have …
Rapid changes at Earth's surface, largely in response to human activity, have led to the realization that fundamental questions remain to be answered regarding the natural functioning of the Critical Zone, the thin veneer at Earth's surface where the atmosphere, lithosphere, hydrosphere and biosphere interact. EARTH 530 will introduce you to the basics necessary for understanding Earth surface processes in the Critical Zone through an integration of various scientific disciplines. Those who successfully complete EARTH 530 will be able to apply their knowledge of fundamental concepts of Earth surface processes to understanding outstanding fundamental questions in Critical Zone science and how their lives are intimately linked to Critical Zone health.
No restrictions on your remixing, redistributing, or making derivative works. Give credit to the author, as required.
Your remixing, redistributing, or making derivatives works comes with some restrictions, including how it is shared.
Your redistributing comes with some restrictions. Do not remix or make derivative works.
Most restrictive license type. Prohibits most uses, sharing, and any changes.
Copyrighted materials, available under Fair Use and the TEACH Act for US-based educators, or other custom arrangements. Go to the resource provider to see their individual restrictions.