Using a glacier proxy, students design an experiment to connect glacial erosion …
Using a glacier proxy, students design an experiment to connect glacial erosion with glacial flow. Students choose from a variety of materials, determined what question they want their experiment or experiments to answer, design the procedure, test the experiment, and write up a lab report on the experiment.
Brief analysis of the geologic setting of the Grand Strand (Myrtle Beach, …
Brief analysis of the geologic setting of the Grand Strand (Myrtle Beach, South Carolina, and vicinity) coast and the limited occurrence of sand suitable for beach re-nourishment. Students use a USGS Fact Sheet to examine the beach, near offshore, and edge of Coastal Plain geology.
This is one component of the Source to Sink Mini Lesson Set …
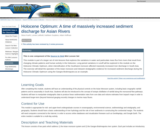
This is one component of the Source to Sink Mini Lesson Set This module is part of a larger set of mini-lessons that explores the variations in water and particulate mass flux from rivers that result from changing climate patterns and human activity in the Holocene. Long-period variations in runoff will be explored in this module on the Holocene Climatic Optimum, when intensification of the Southwest monsoon affected massively increased river discharge in South Asia. The exercise will detail the operation of the Asian monsoon and interpret stratigraphic evidence for increased sediment discharge during the Holocene Climatic Optimum using the Ganges-Brahmaputra as an example.
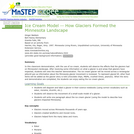
This activity is a teacher demonstration of an ice cream model representing …
This activity is a teacher demonstration of an ice cream model representing glacier movement across Minnesota. Teacher/student questions and discussion should be encouraged during the demonstration.
This is an online activity introducing students to the basic identification and …
This is an online activity introducing students to the basic identification and classification of the textural and compositional characteristics of sedimentary rocks in thin section.
An exercise to use a simple image analysis program to classify land …
An exercise to use a simple image analysis program to classify land surface types seen in satellite imagery in order to analyze changes in landscape development over time.
(Note: this resource was added to OER Commons as part of a batch upload of over 2,200 records. If you notice an issue with the quality of the metadata, please let us know by using the 'report' button and we will flag it for consideration.)
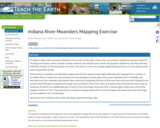
In Indiana, major rivers and their tributaries cross much of the state. …
In Indiana, major rivers and their tributaries cross much of the state. These rivers can produce significant hazards related to flooding and erosion, which threaten nearby residents and infrastructure. Rivers are dynamic landforms, and they naturally shift their position on the landscape over time. The path of a river may change rapidly during a flood, or it may slowly evolve over long periods of time. In this exercise, students use hillshade images derived from airborne lidar (light detection and ranging) from a section of the White River in Indiana to map how the river has changed over the span of five years. Students learn to identify and describe how river meanders and oxbow lakes evolve by comparing the form of the river from 2013 and 2018. Students also use the lidar hillshade to evaluate the longer-term evolution of the river's form and assess how local infrastructure may be impacted. Students are additionally given a plot of river discharge measured from a stream gage station just north of the mapped section of river. They learn how to evaluate changes and trends in river discharge and assess how river discharge can be related to river morphology.
This is a field investigation where students will explore and observe sediments …
This is a field investigation where students will explore and observe sediments within a local gravel pit and from their observation create an investigation that will help to determine the nature of the sediments.
This activity is a interdisciplinary field investigation where students will form observations …
This activity is a interdisciplinary field investigation where students will form observations and make calculations about stream characteristics and stream flow.
This activity is a field investigation where students will observe the topography …
This activity is a field investigation where students will observe the topography of Big Stone Lake and generate questions about the history of this area.
This lab or in-class exercise is based on an actual experiment that …
This lab or in-class exercise is based on an actual experiment that appeared in the journal "Science" (Densmore et al., 1997) that used an analog model to simulate the role of bedrock landslides in long-term landscape evolution. Students essentially replicate this experiment by using an acrylic-walled slope failure box filled with either red beans or rice to simulate the landscape. A sliding door on one long side of the box simulates downcutting of the landscape by a river. Lowering the door leads to 'rock' avalanches; students weigh the material that fails and trace slope profiles on the sidewall of the box. As a result of this data collection process, they create a time series of slope failures and slope profiles that shows (a) that large landslides are interspersed with smaller landslides; (b) that oversteepened toes of slope may be an equilibrium landform; and (c) that the type of material that fails will in part govern the nature of the failures, slope profiles, and time series that they detect. Their task is to hypothesize about the behavior of the experiment before running it, then replicate the Densmore et al. (1997) experiment. They then analyze their data and submit a lab report that examines their results in light of the 'Science' article. The activity allows students to read the scientific literature, to collect and analyze real data, to investigate the nature of equilibrium, and to gain a gut feeling for the controls on slope failure.
(Note: this resource was added to OER Commons as part of a batch upload of over 2,200 records. If you notice an issue with the quality of the metadata, please let us know by using the 'report' button and we will flag it for consideration.)
Students will make observations at two different locations and will infer the …
Students will make observations at two different locations and will infer the geological events that happened at each location to explain what they see and create questions for further study.
This activity is a field investigation where students make observations in the …
This activity is a field investigation where students make observations in the Minnesota River valley, discuss their findings amongst other student groups, and describe how those observations fit with the general geology of Minnesota.
Using a combination of water, effervescent antacid tablets, dishwashing liquid and simple …
Using a combination of water, effervescent antacid tablets, dishwashing liquid and simple materials, students model volcanic eruptions to measure the intensity of explosivity and develop their own scale.
Utilizing online and traditional resources students will collect data on planets and …
Utilizing online and traditional resources students will collect data on planets and moons in our solar system. Working collaboratively students will generate a spreadsheet of the data. After verifying one another's information, they will then use the spreadsheet to try and determine ways in which the Earth is unique amongst the objects in our solar system, including, but not limited to, the reasons behind Earth's ability to support life.
(Note: this resource was added to OER Commons as part of a batch upload of over 2,200 records. If you notice an issue with the quality of the metadata, please let us know by using the 'report' button and we will flag it for consideration.)
Given a cross-sectional diagram of two rock outcrops (From Earth: Portrait of …
Given a cross-sectional diagram of two rock outcrops (From Earth: Portrait of a Planet 4th edition by Stephan Marshak. Copyright  2012, 2008, 2005, 2001 by W.W. Norton & Company, Inc. Used by permission of W. W. Norton & Company, Inc.), Part 1 of this activity asks students to sketch a fault structure that would explain the rock configuration. Labels for all important parts of the fault are required (hanging wall, foot wall, arrows indicating movement and the maximum stress direction). The fault must be identified as either normal or reverse. Only one of two possible solutions is required.
Given a map template, Part 2 asks students to sketch a geological map of the outcrops based on their fault from Part 1. Required elements include all lithological contacts, strike/dip symbols, structural labels and a proper legend.
Part 3 of this activity gives students the same schematic cross-section as in Part 1, except now they have to draw folds that would explain the rock configuration. Labels for the hinge line, axial plane and maximum stress direction must be included.
Students will use GeoMapApp to investigate variations in the geomorphology of continental …
Students will use GeoMapApp to investigate variations in the geomorphology of continental margins -- both Passive and Active -- at various sites of the North American and South American continents. They will then construct a table of observations that will relate margin geomorphology and seismic activity, followed by general interpretations for the causes of the variations observed. Even if students are already familiar with Plate Tectonics and know the associations among plate boundaries, seismic activity and continental margin geomorphology, they will practice developing their observation skills for comparative analyses and interpretations.
(Note: this resource was added to OER Commons as part of a batch upload of over 2,200 records. If you notice an issue with the quality of the metadata, please let us know by using the 'report' button and we will flag it for consideration.)
This unit is to be taught as an extension to the FOSS …
This unit is to be taught as an extension to the FOSS WATER INVESTIGATION 1, Part 3, WATER ON A SLOPE. After learning that water flows down a slope, students will understand that this concept determines how our watersheds flow. It will also explain why some rivers (such as the Red River) appear to be flowing "up" on a map. They will then create a landform map of Minnesota accurately representing the higher elevations (our RIDGELINES) and the location of our major rivers and bodies of water. This unit can also be extended by many of the activities in the Project Wild and the MinnAqua Lesson Books.
No restrictions on your remixing, redistributing, or making derivative works. Give credit to the author, as required.
Your remixing, redistributing, or making derivatives works comes with some restrictions, including how it is shared.
Your redistributing comes with some restrictions. Do not remix or make derivative works.
Most restrictive license type. Prohibits most uses, sharing, and any changes.
Copyrighted materials, available under Fair Use and the TEACH Act for US-based educators, or other custom arrangements. Go to the resource provider to see their individual restrictions.