Video and animations of sea level from NASA's Climate website. Since 1992, …
Video and animations of sea level from NASA's Climate website. Since 1992, NASA and CNES have studied sea surface topography as a proxy for ocean temperatures. NASA Missions TOPEX/Poseidon, Jason 1 and Jason 2 have been useful in predicting major climate, weather, and geologic events including El Nino, La Nina, Hurricane Katrina, and the Indian Ocean Tsunami.
Following the guide, teachers in partners’ schools developed a dossier of learning …
Following the guide, teachers in partners’ schools developed a dossier of learning resources for the students. These resources are e.g. textbooks, worksheets, reference books, study guides etc. The students’ activities were carried out, as projects, with the overall aim to transform the school into a Blue school. Learning resources in this case could be tools useful for students that will help them implement their projects. Thus, students’ projects included exploration of local occupations, development of entrepreneurial ideas for sustainable businesses, projects with local community, protection of sea environment and sea life, painting the walls of the school with subjects related to the sea life, collage of relevant pictures and articles, collecting garbage from the coast and producing art out of it, organising culinary events with seafood at school inviting vulnerable groups to eat, inviting tourists to a cultural event, decorating a place in the community, inventing slogans etc.The specific goal of this output was to help students in a very practical and “learning by doing” way to realise and understand the importance of sea and marine environment in their local economy and how sealife and environmental sustainability affects life in coastal areas and has to be preserved and enhanced
Water has unique properties, density is one of the most important as …
Water has unique properties, density is one of the most important as it is related to convection and density driven circulation in the ocean. Liquid water is densest at 4ºC, not the solid ice phase, which is lighter. This explains why ice floats in the ocean and cold, dense liquid water sinks. Saltwater adds another dimension by increasing the density of water. The combination of temperature and salinity produces a overturning, density driven circulation in the ocean or thermohaline circulation.
Convection circulation is the thermally driven with warm, less dense water rising and cold, dense water sinking, similar to boiling water on the stove. A short video demonstration of thermohaline circulation, called wind in a bowl illustrates the warm rising and cold sinking convection circulation. The video also shows that ice floats and the meltwater from the ice sinks. This demo could be conducted live in class.
The lesson should include a discussion of the properties of water, density and convection circulation with a demonstration of the properties. Then have the students work together on a problem in which warmer water than the bowl water is added to the surface of water. What would happen to the circulation? Then discuss how thermohaline circulation can be disrupted and how this relates to abrupt climate change and examples from the past such as the Younger Dryas. This can be demonstrated by adding warmer water than the bowl water (20ºC) with green food coloring to the water bowl.
This activity is a mini-research project in which students independently investigate the …
This activity is a mini-research project in which students independently investigate the variety of natural resources mined from the Earth and the broader implications of this mining. Students then give very short presentations of their findings to the class as a whole.
(Note: this resource was added to OER Commons as part of a batch upload of over 2,200 records. If you notice an issue with the quality of the metadata, please let us know by using the 'report' button and we will flag it for consideration.)
What would happen if a portion of the Antarctic Ice Sheet were …
What would happen if a portion of the Antarctic Ice Sheet were to melt? This video segment adapted from NOVA uses animations to show the effect of a 6-meter sea-level rise on coastal cities across the world.
A learning activity for the "Do You Know That Clouds Have Names?" …
A learning activity for the "Do You Know That Clouds Have Names?" book in the Elementary GLOBE series. Using information from the book and their observations, students construct a sky scene with trees and buildings as reference points on the ground and cloud types ordered by altitude in the sky. Students will describe clouds using their own vocabulary and will then correlate their descriptions with the standard classifications of cloud types used by the GLOBE Program. The purpose of the activity is to help students identify some of the characteristics of clouds and to enable students to observe clouds, describe them in a common vocabulary, and compare their descriptions with the official cloud names. Students will be able to identify cloud types using standard cloud classification names. They will know that the names used for the clouds are based on three factors: their shapes, the altitude at which they occur, and whether they are producing precipitation.
This activity covers the role that the oceans may play in climate …
This activity covers the role that the oceans may play in climate change and how climate change may affect the oceans. It is lesson 8 in a nine-lesson module Visualizing and Understanding the Science of Climate Change.
In this activity, learners conduct a simple experiment to see how electrically …
In this activity, learners conduct a simple experiment to see how electrically charged things like plastic attract electrically neutral things like water. The plastic will attract the surface of the water into a visible bump.
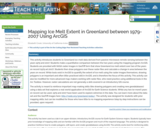
This activity introduces students to Greenland ice-melt data derived from passive microwave …
This activity introduces students to Greenland ice-melt data derived from passive microwave remote sensing between the years 1979 and 2007. Students make a quantitative comparison between the two years using the mapping program ArcGIS. Students are provided with NASA raster images in GeoTiff form that show Greenland ice melt extent over two of the years on record (1979 ad 2007). Students then draw polygons over these raster files and calculate a change in area between the years on record. While tools exist in ArcGIS to quantify the extent of ice melt using the raster images themselves, drawing polygons is an important and often little-practiced skill in ArcGIS, and is therefore the focus of this activity. This activity can also be modified for more advanced map-makers working with raster files, who need practice using additional tools in the Arc Toolbox. However, raster calculations are not generally a skill covered in an introductory GIS course. The activity is meant to reinforce important map-making skills (like drawing polygons and creating new geodatabases) using a data set that explores a real-world application of ArcGIS for Earth Science students. While any two (or more!) years on record can be used, 1979 and 2007 have been used to explore extremes in the data. You can learn more about the data set and the GeoTiff images here: http://nsidc.org/greenland-today/. The activity was designed for students with prior mapping skills, but can be modified for those who have little to no mapping experience (step by step instructions can be provided, upon request).
Students use a Python script to download position, size and foretasted position …
Students use a Python script to download position, size and foretasted position and size of hurricanes into a spreadsheet from NOAA hurricane forecasts. They then display the actual and foretasted hurricane positions in ArcMap. Finally students look at which counties in the United States have had the highest amount of hurricane activity. Students display their work in a multi-part map, or a series of maps.
This course presents the phenomena, theory, and modeling of turbulence in the …
This course presents the phenomena, theory, and modeling of turbulence in the Earth’s oceans and atmosphere. The scope ranges from centimeter to planetary scale motions. The regimes of turbulence include homogeneous isotropic three dimensional turbulence, convection, boundary layer turbulence, internal waves, two dimensional turbulence, quasi-geostrophic turbulence, and macrotrubulence in the ocean and atmosphere.
Course 12.307 is an undergraduate course intended to illustrate, by means of …
Course 12.307 is an undergraduate course intended to illustrate, by means of ‘hands on’ projects, the basic dynamical and physical principles that govern the general circulation of the atmosphere and ocean and the day to day sequence of weather events. The course parallels the content of the new undergraduate textbook Atmosphere, Ocean and Climate Dynamics by John Marshall and R. Alan Plumb.
Once the pride of the German Navy, this 700 foot long heavy …
Once the pride of the German Navy, this 700 foot long heavy cruiser was used by the U.S. as a test target for not one but two atom bombs at Bikini atoll. Today, at the bottom of the ocean, the radiation levels of the Prinz Eugen are low enough for safe exploration. In this video, Jonathan joins historian Mark Miller on a trip to explore this mysterious shipwreck. What they find about the condition of this wreck is surprising. Please see the accompanying lesson plan for educational objectives, discussion points and classroom activities.
In this unit, students will explore how global climate change impacts marine …
In this unit, students will explore how global climate change impacts marine ecosystems (especially kelp forests and coral reefs) and the survival and migration patterns of species within marine ecosystems. Students will examine how marine resources and fisheries upon which humans depend (especially marginalized and vulnerable human populations) are being affected by ocean warming and what we can learn from Indigenous peoples on how to mitigate the effects of ocean warming. Lastly, students will learn about innovative solutions to addressing the impacts of ocean warming and propose their own solution to the problem.
This activity proposes different small experiments and discussions to show that in …
This activity proposes different small experiments and discussions to show that in the summer it is cooler by the sea than on the land and that water cools off more slowly than soil.
Giant clams are no myth. In New England, people love clam chowder, …
Giant clams are no myth. In New England, people love clam chowder, but in the Pacific, some of the clams are as big as a suitcase! In this video filmed in Micronesia, Jonathan goes in search of Giant Clams. These clams are so big that people used to think they caught people...and it almost looks like they could. It turns out that the real problem is that too many people are eating the clams. Please see the accompanying lesson plan for educational objectives, discussion points and classroom activities.
The Regulating Role of the Ocean on the Climate - Sébastien Carassou …
The Regulating Role of the Ocean on the Climate - Sébastien Carassou This video is part of the Billes de sciences series, produced by the Fondation La Main à la
No restrictions on your remixing, redistributing, or making derivative works. Give credit to the author, as required.
Your remixing, redistributing, or making derivatives works comes with some restrictions, including how it is shared.
Your redistributing comes with some restrictions. Do not remix or make derivative works.
Most restrictive license type. Prohibits most uses, sharing, and any changes.
Copyrighted materials, available under Fair Use and the TEACH Act for US-based educators, or other custom arrangements. Go to the resource provider to see their individual restrictions.