Updating search results...

Search Resources

1520 Results

View
Selected filters:
Mathematics for Quantum Physics
Unrestricted Use
CC BY
Rating
0.0 stars

Mathematics for Quantum Physics provides a compact introduction to the most important mathematical tools used in quantum mechanics. The text is aimed at students who already possess basic knowledge of calculus and complex numbers. It is divided into three parts: analysis, linear algebra and probability. The focus is on examples and applications, and each section comes with a collection of exercises.

Subject:
Mathematics
Material Type:
Interactive
Textbook
Provider:
Delft University of Technology
Author:
Peter Bruin
Date Added:
11/09/2023
Remote Learning Plan: Inverse Functions 9-12
Conditional Remix & Share Permitted
CC BY-NC-SA
Rating
0.0 stars

This Remote Learning Plan was created by Jennifer Gier in collaboration with Tyler Cronin and Craig Hicks as part of the 2020 ESU-NDE Remote Learning Plan Project. Educators worked with coaches to create Remote Learning Plans as a result of the COVID-19 pandemic.The attached Remote Learning Plan is designed for Grades 7-12 math students. Students will learn to identify and create inverse functions algebraically and graphically. This Remote Learning Plan addresses the following NDE Standard: 11.2.1hIt is expected that this Remote Learning Plan will take students 90 minutes to complete.Here is the direct link to the Google Slide: https://docs.google.com/presentation/d/1Jp2zJ3gAt4VqOFCJc1z3vk7Zr0hstKgGhgsqDnbBHDw/edit?usp=sharing 

Subject:
Mathematics
Material Type:
Activity/Lab
Homework/Assignment
Interactive
Lesson
Author:
Jenny Gier
Date Added:
07/22/2020
Representing and Solving Linear Functions
Only Sharing Permitted
CC BY-NC-ND
Rating
0.0 stars

In eighth grade, students studied how linear functions represented by equations, tables, and graphs can be used to model and solve real world situations. Particular attention was given to using the rate of change and initial value from multiple representations to model the relationship between two values with the generalizable function, y=mx+b. In Algebra 1, students continue using and making connections between representations of linear functions. A common misconception when making connections between representations is that constant rate of change and slope can be used interchangeably when “a linear function does not have slope, but the graph of a non-vertical line has a slope.” (High School Functions progression document, page 6) Unit 2 establishes a deep understanding of the characteristics of linear functions. This understanding includes exploring linear functions geometrically by analyzing the effects of transformations on the graph by replacing f(x) by f(x) + k, kf(x), f(kx) and f(x + k) for specific values of k. These understandings allow students to compare linearity to function families studied in future units (e.g., exponential, quadratic).

In this unit, students will extend their focus from slope intercept form to reasoning about standard form and point slope form. Students begin to make distinctions about which of these forms are most beneficial when modeling a real world situation. Different contexts lend themselves to different forms of linear equations. Students may build a function to model a situation, using parameters from that situation (e.g., rate of change, start value, ordered pair). Other situations are more efficiently modeled with standard form (e.g., Dana purchased 3 brauts and 4 drinks for $8.50). Symbolic manipulation from one form to another can reveal new characteristics of the function or assist in solving systems of equations.

In 6th and 7th grade students solved one and two step equations and inequalities algebraically. In 8th grade students solved linear equations using graphs, tables, and algebraic manipulation. In this unit, students will apply what they know about solving equations and inequalities to solving multi-step inequalities which include variables on both sides. Students will make sense of what a solution means for an equation compared to an inequality. Students will extend their understanding of solving linear equations with two variables. First, they will manipulate equations to solve for specific variables. Second, students will justify their reasoning by supplying mathematical properties to explain each step in solving an equation. This work will help set the groundwork for mathematical proofs in tenth grade.

In addition, students will extend their 8th grade understanding of solving systems of linear equations to include systems of linear inequalities as representations of real world situations. Students will solve systems of linear equations exactly (e.g. with substitution principle, combination/elimination), and approximately (e.g., with graphs) with a new emphasis on the conceptual understanding and justification of why these strategies work. Students will compare and contrast the benefit of using each of these strategies in different situations.

In this unit students are using what they know about linear functions to build new understandings of piecewise linear functions including absolute value functions. In addition, students will use tables and graphs to solve absolute value equations as described in HSA.REI.D.11. The Michigan State Standards no longer require students to be able to algebraically solve piecewise and absolute value functions.

Subject:
Mathematics
Material Type:
Module
Unit of Study
Date Added:
06/20/2017
PVSTEM9 Slow Car Challenge - How Slow Can You Go?
Conditional Remix & Share Permitted
CC BY-NC
Rating
0.0 stars

Build the slowest moving LEGO car (or other vehicle dependent on gears and moves at a constant velocity), predict exactly when and where that will crash into another one a set distance apart.
Combines Physics, Tech Ed, and Algebra I concepts very well.

Subject:
Applied Science
Engineering
Physical Science
Physics
Material Type:
Activity/Lab
Date Added:
12/06/2018
Equation Grapher
Unrestricted Use
CC BY
Rating
0.0 stars

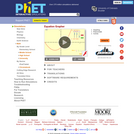
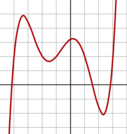
Learn about graphing polynomials. The shape of the curve changes as the constants are adjusted. View the curves for the individual terms (e.g. y=bx ) to see how they add to generate the polynomial curve.

Subject:
Algebra
Mathematics
Material Type:
Simulation
Provider:
University of Colorado Boulder
Provider Set:
PhET Interactive Simulations
Author:
Michael Dubson
Mindy Gratny
Trish Loeblein
Date Added:
11/16/2007
Lines and Linear Equations
Only Sharing Permitted
CC BY-NC-ND
Rating
0.0 stars

This lesson unit is intended to help teahcers assess how well students are able to interpret speed as the slope of a linear graph and translate between the equation of a line and its graphical representation.

Subject:
Algebra
Mathematics
Material Type:
Assessment
Lesson Plan
Provider:
Shell Center for Mathematical Education
Provider Set:
Mathematics Assessment Project (MAP)
Date Added:
04/26/2013
Introduction to Stochastic Processes
Conditional Remix & Share Permitted
CC BY-NC-SA
Rating
0.0 stars

This course is an introduction to Markov chains, random walks, martingales, and Galton-Watsom tree. The course requires basic knowledge in probability theory and linear algebra including conditional expectation and matrix.

Subject:
Mathematics
Statistics and Probability
Material Type:
Full Course
Provider:
MIT
Provider Set:
MIT OpenCourseWare
Author:
Wu, Hao
Date Added:
02/01/2015
Classifying Solutions to Systems of Equations
Only Sharing Permitted
CC BY-NC-ND
Rating
0.0 stars

This lesson unit is intended to help teachers assess how well students are able to classify solutions to a pair of linear equations by considering their graphical representations. In particular, this unit aims to help teachers identify and assist students who have difficulties in: using substitution to complete a table of values for a linear equation; identifying a linear equation from a given table of values; and graphing and solving linear equations.

Subject:
Algebra
Mathematics
Material Type:
Assessment
Lesson Plan
Provider:
Shell Center for Mathematical Education
Provider Set:
Mathematics Assessment Project (MAP)
Date Added:
04/26/2013
Solve Inequalities
Read the Fine Print
Rating
0.0 stars

Represent inequalities on a number line.
Represent inequalities using interval notation.
Use the addition and multiplication properties to solve algebraic inequalities and express their solutions graphically and with interval notation.
Solve inequalities that contain absolute values.
Combine properties of inequalities to isolate variables, solve algebraic inequalities, and express their solutions graphically.
Simplify and solve algebraic inequalities using the distributive property to clear parentheses and fractions.

Subject:
Algebra
Mathematics
Material Type:
Lesson Plan
Teaching/Learning Strategy
Provider:
Lumen Learning
Date Added:
12/14/2017
Numerical Computation for Mechanical Engineers
Conditional Remix & Share Permitted
CC BY-NC-SA
Rating
0.0 stars

This class introduces elementary programming concepts including variable types, data structures, and flow control. After an introduction to linear algebra and probability, it covers numerical methods relevant to mechanical engineering, including approximation (interpolation, least squares and statistical regression), integration, solution of linear and nonlinear equations, ordinary differential equations, and deterministic and probabilistic approaches. Examples are drawn from mechanical engineering disciplines, in particular from robotics, dynamics, and structural analysis. Assignments require MATLAB® programming.

Subject:
Algebra
Applied Science
Engineering
Mathematics
Statistics and Probability
Material Type:
Full Course
Provider:
MIT
Provider Set:
MIT OpenCourseWare
Author:
Frey, Daniel
Hadjiconstantinou, Nicholas
Patera, Anthony
Date Added:
09/01/2012
Guess My Number
Unrestricted Use
CC BY
Rating
0.0 stars

This problem asks the students to represent a sequence of operations using an expression and then to write and solve simple equations. The problem is posed as a game and allows the students to visualize mathematical operations. It would make sense to actually play a similar game in pairs first and then ask the students to record the operations to figure out each other's numbers.

Subject:
Algebra
Mathematics
Material Type:
Activity/Lab
Provider:
Illustrative Mathematics
Provider Set:
Illustrative Mathematics
Author:
Illustrative Mathematics
Date Added:
08/07/2012
Learn Differential Equations: Up Close with Gilbert Strang and Cleve Moler
Conditional Remix & Share Permitted
CC BY-NC-SA
Rating
0.0 stars

Learn Differential Equations: Up Close with _Gilbert Strang and_ Cleve Moler is an in-depth series of videos about differential equations and the MATLAB® ODE suite. These videos are suitable for students and life-long learners to enjoy.
About the Instructors
Gilbert Strang is the MathWorks Professor of Mathematics at MIT. His research focuses on mathematical analysis, linear algebra and PDEs. He has written textbooks on linear algebra, computational science, finite elements, wavelets, GPS, and calculus.
Cleve Moler is chief mathematician, chairman, and cofounder of MathWorks. He was a professor of math and computer science for almost 20 years at the University of Michigan, Stanford University, and the University of New Mexico.
These videos were produced by The MathWorks and are also available on The MathWorks website.

Subject:
Algebra
Applied Science
Computer Science
Engineering
Mathematics
Material Type:
Full Course
Provider:
MIT
Provider Set:
MIT OpenCourseWare
Author:
Moler, Cleve
Strang, Gilbert
Date Added:
09/01/2015
Number Properties
Conditional Remix & Share Permitted
CC BY-NC
Rating
0.0 stars

In this seminar you will look at the commutative, associative, and distributive properties to better understand how they are used in mathematics. You may see some similarities among these properties, but you will find large differences as well. These differences are important to recognize when completing problems, or else you will find yourself getting wrong answers. You will also explore identity and inverses, which are used so often in math (often without your even knowing it!).  A majority of the time will be spent on the distributive property as it tends to be the property used most moving forward in math. Understanding these basic number properties is important in working with numbers and equations later in the course.StandardsCC.2.2.HS.D.2Write expressions in equivalent forms to solve problems. 

Subject:
Algebra
Material Type:
Lesson Plan
Author:
Tracy Rains
Date Added:
03/14/2018
Polynomials Investigation
Conditional Remix & Share Permitted
CC BY-NC-SA
Rating
0.0 stars

The purpose of this lesson is for students to discover the connection between the algebraic and the graphical structure of polynomial functions. This lesson leads to students being able to sketch a graph by identifying the end behavior, intercepts, and multiplicities from a given polynomial equation. It also leads to students being able to write a possible equation by determining the sign of the leading coefficient, minimum possible degree, x-intercepts and y-intercept from a given polynomial graph. 

Subject:
Algebra
Functions
Material Type:
Activity/Lab
Lesson
Lesson Plan
Author:
Victoria Olinde
Date Added:
03/20/2021
Computational Science and Engineering I
Conditional Remix & Share Permitted
CC BY-NC-SA
Rating
0.0 stars

This course provides a review of linear algebra, including applications to networks, structures, and estimation, Lagrange multipliers. Also covered are: differential equations of equilibrium; Laplace's equation and potential flow; boundary-value problems; minimum principles and calculus of variations; Fourier series; discrete Fourier transform; convolution; and applications.
Note: This course was previously called "Mathematical Methods for Engineers I."

Subject:
Algebra
Applied Science
Computer Science
Engineering
Mathematics
Material Type:
Full Course
Provider:
MIT
Provider Set:
MIT OpenCourseWare
Author:
Strang, Gilbert
Date Added:
09/01/2008
Steps to Solving Equations
Only Sharing Permitted
CC BY-NC-ND
Rating
0.0 stars

This lesson unit is intended to help teachers assess how well students are able to: form and solve linear equations involving factorizing and using the distributive law. In particular, this unit aims to help teachers identify and assist students who have difficulties in: using variables to represent quantities in a real-world or mathematical problem and solving word problems leading to equations of the form px + q = r and p(x + q) = r.

Subject:
Algebra
Mathematics
Material Type:
Assessment
Lesson Plan
Provider:
Shell Center for Mathematical Education
Provider Set:
Mathematics Assessment Project (MAP)
Date Added:
04/26/2013
Parabolas: Discovering the Vertex Equation
Only Sharing Permitted
CC BY-NC-ND
Rating
0.0 stars

Grade Level: Students taking Algebra 2Content: The curriculum being discussed is creating the vertex equation for a parabola from the parent equation.Previous Knowledge: Students should know how to transform a linear equation. That knowledge will aid when they are manipulating the quadratic equation.Students should know the basic quadratic equation information and how it affects the graph i.e. x-intercepts, vertex, axis of symmetry.Students should know that a basic (parent) quadratic equation is y = x².Objective: Be able to write an equation for a parabola in vertex form given multiple parameters. Will also use technology to aid in this discovery.IntroductionAfter reviewing the objectives for the day’s lesson, I have students open their notebooks. Then, I let students know that I want them to take notes as they watch a 2-minute video over quadratic functions and parabolas in the real world.After the video is complete, I ask students to complete the following Think-Pair-Share protocol:Think – 2 minutes to write down your thoughts and update your notes from watching the videosPair – 3-5 minutes to compare and contrast your ideas with a partnerShare – 5-10 minute class discussion of ideas answering the prompt “Describe different characteristics of quadratic functions and their graphs”VocabularyParabolaQuadratic EquationVertexAxis of SymmetryMinimumMaximumBody of LessonThe students will get into pairs to log in to the desmos website. They will be given approximately ten different scenarios of how to move their parabola. For instance, they will be given the parent equation of y = x² and told to move it five units to the left. The student will have to guess where to represent the five in the equation to make the entire graph move five units. The different scenarios could include moving the graph right or left, up or down, and stretching or compressing the parabola.After they have worked out the different scenarios, the students will work with their partners to create the formula for vertex form for a quadratic equation.Next, the students will then use the equation they just created to help them in graphing more parabolas.As part of the closure, we will discuss as a class how the actual vertex (h, k) relates to the equation.Accommodations/ ModificationsGo around the classroom and make sure all students understand what to doPair students with a compatible partner so they can teach each otherProvide extra time for students to finish assignment or assessmentsReduce independent practice to half of the problemsAllow students to use the textbook in their first language or use a Dictionary to help them translate words so that they understand what is being asked of them​​​​​​​AssessmentThe the students will be given a quiz over the concept of parabolas the next day.The students will be assessed over this concept at the end of the chapter on the chapter test.​​​​​​​MaterialsTextbookComputer with Internet ConnectionNotebookPencil​​​​​​​StandardsA-CED 2. Create equations in two or more variables to represent relationships between quantities; graph equations on coordinate axes with labels and scales.F-IF 7. Graph functions expressed symbolically and show key features of the graph, by hand in simple cases and using technology for more complicated cases.F-BF 3. Identify the effect on the graph of replacing f(x) by f(x) + k, kf(x), f(kx), and f(x + k) for specific values of k (both positive and negative); find the value of k given the graphs. Experiment with cases and illustrate an explanation of the effects on the graph using technology.MA 11.2.1.g Analyze and graph quadratic functions (standard form, vertex form, finding zeros, symmetry, transformations, determine intercepts, and minimums or maximums)​​​​​​​

Subject:
Algebra
Material Type:
Lesson Plan
Author:
Christina Hubl
Richanne Dolfi
Date Added:
01/28/2018
Multi-Step Equations
Unrestricted Use
Public Domain
Rating
0.0 stars

This is a set of three, one-page problems about mass and power of spacecraft. Learners will use multi-step equations to solve several diverse problems. Options are presented so that students may learn about different types of power systems to generate electricity through a NASA press release or by viewing a NASA eClips video [7 min.]. This activity is part of the Space Math multi-media modules that integrate NASA press releases, NASA archival video, and mathematics problems targeted at specific math standards commonly encountered in middle school.

Subject:
Astronomy
Mathematics
Physical Science
Material Type:
Lesson
Provider:
NASA
Provider Set:
Space Math
Date Added:
11/05/2014
Walk the Line: A Module on Linear Functions
Read the Fine Print
Educational Use
Rating
0.0 stars

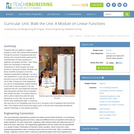
Prepared with pre-algebra or algebra 1 classes in mind, this module leads students through the process of graphing data and finding a line of best fit while exploring the characteristics of linear equations in algebraic and graphic formats. Then, these topics are connected to real-world experiences in which people use linear functions. During the module, students use these scientific concepts to solve the following hypothetical challenge: You are a new researcher in a lab, and your boss has just given you your first task to analyze a set of data. It being your first assignment, you ask an undergraduate student working in your lab to help you figure it out. She responds that you must determine what the data represents and then find an equation that models the data. You believe that you will be able to determine what the data represents on your own, but you ask for further help modeling the data. In response, she says she is not completely sure how to do it, but gives a list of equations that may fit the data. This module is built around the legacy cycle, a format that incorporates educational research feindings on how people best learn.

Subject:
Algebra
Applied Science
Engineering
Geoscience
Life Science
Mathematics
Physical Science
Material Type:
Unit of Study
Provider:
TeachEngineering
Provider Set:
TeachEngineering
Author:
Aubrey Mckelvey
Date Added:
09/18/2014