Students will test the percolation rates of 6 different soil samples. Three …
Students will test the percolation rates of 6 different soil samples. Three of the samples are measured sand and clay and three are collected from the schoolyard and wetland.
In this activity, students act as water molecules and travel through parts …
In this activity, students act as water molecules and travel through parts of the water cycle (ocean, atmosphere, clouds, glaciers, snow, rivers, lakes, ground, aquifer). Students use a diagram of the hydrologic cycle to draw the pathway they traveled.
In this activity students build a model of a watershed to learn …
In this activity students build a model of a watershed to learn where water goes when it rains. Students then make predictions and draw what they observe.
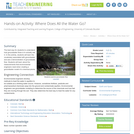
Spreadsheets Across the Curriculum module/Geology of National Parks course. Students use a …
Spreadsheets Across the Curriculum module/Geology of National Parks course. Students use a rating curve to determine discharge at various stage heights.
Students learn about physical models of groundwater and how environmental engineers determine …
Students learn about physical models of groundwater and how environmental engineers determine possible sites for drinking water wells. During the activity, students create their own groundwater well models using coffee cans and wire screening. They add red food coloring to their models to see how pollutants can migrate through the groundwater into a drinking water resource.
In this activity, students use models to investigate the process and consequences …
In this activity, students use models to investigate the process and consequences of water contamination on the land, groundwater, and plants. This is a good introduction to building water filters found in the associated activity, The Dirty Water Project.
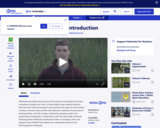
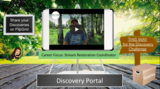
Every step we take is in a watershed. Let's learn more about …
Every step we take is in a watershed. Let's learn more about them! Check out the Stream Restoration Coordinator video to learn how scientists help improve stream health. Then, in the Discovery Challenge video, observe, investigate, and record information about your watershed from a distance and then really close up . Then, after learning a little more about watersheds, we will create models of watersheds and use those models to investigate how soil and chemicals might move through our watersheds.
This lesson introduces NGSS standards, and those standards are listed in the lesson and is part of the Explore Science Club series, an online Career Connected Learning program developed by the Greater Oregon STEM Hub. To learn more find us at: www.go-stem.org.
In this exercise, students predict changes in the movement of a dissolved …
In this exercise, students predict changes in the movement of a dissolved plume in response to remedial pumping in an unconfined aquifer. The underlying conceptual model for the distribution of aquifer and aquitard materials is not known with certainty. Consequently, two alternative end-member conceptualizations are presented to students who are then asked to hypothesize differences in predicted responses at the pumping wells and nearby monitoring wells for each conceptual model. Predictions are compared to actual field data, and students discover that contaminant concentration measurements depend not only on the location of the observation point (in three dimensions), but also on the length of the screened interval through which water samples are collected. The activity is divided into three parts: (1) site/problem description, (2) formulation and testing of hypotheses for pumping wells, and (3) formulation and testing of hypotheses for monitoring wells. The activity gives students practice in three dimensional thinking and reinforces their intuitive understanding of contaminant plume migration in response to natural gradients and engineered stresses.
(Note: this resource was added to OER Commons as part of a batch upload of over 2,200 records. If you notice an issue with the quality of the metadata, please let us know by using the 'report' button and we will flag it for consideration.)
The best way for students to understand how groundwater flows is to …
The best way for students to understand how groundwater flows is to actually see it. In this activity, students will learn the vocabulary associated with groundwater and see a demonstration of groundwater flow. Students will learn about the measurements that environmental engineers need when creating a groundwater model of a chemical plume.
Students learn about the Earth's water cycle, especially about evaporation. Once a …
Students learn about the Earth's water cycle, especially about evaporation. Once a dam is constructed, its reservoir becomes a part of the region's natural hydrologic cycle by receiving precipitation, storing runoff water and evaporating water. Although almost impossible to see, and not as familiar to most people as precipitation, evaporation plays a critical role in the hydrologic cycle, and is especially of interest to engineers designing new dams and reservoirs, such as those that Splash Engineering is designing for Thirsty County.
Hands-on outdoor lesson plan for students to understand the meaning and components …
Hands-on outdoor lesson plan for students to understand the meaning and components of climate change, and engineer and model how greenhouse gasses cause heat trapping.
This short demonstration will open students' eyes to the distribution of various …
This short demonstration will open students' eyes to the distribution of various water sources on our Earth, but also the limited amount of fresh water for our daily use.
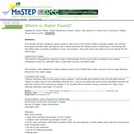
The majority of Earth's surface is covered by water, but only a …
The majority of Earth's surface is covered by water, but only a small percentage of this water is freshwater. In this lesson, students will learn where saltwater and freshwater are found. Then they will use models to show the distribution of different types of water in different reservoirs and depict this information using bar graphs and pie charts. Finally, they will use their data as evidence to support the idea that freshwater should be conserved. This lesson was created as part of the 2016 NASA STEM Standards of Practice Project, a collaboration between the Alabama State Department of Education and NASA Marshall Space Flight Center.
Students are provided with a 3D perspective of a virtual place, descriptions …
Students are provided with a 3D perspective of a virtual place, descriptions of geologic and cultural aspects, and a table with water-table elevations in groundwater and contaminant levels in water wells, springs, and rivers. Students use these data to contour water-table elevations, determine the direction of groundwater flow, and identify industrial sites that are likely sources of contamination. They then propose a remediation plan and identify water wells that are likely to remain uncontaminated in the future.
(Note: this resource was added to OER Commons as part of a batch upload of over 2,200 records. If you notice an issue with the quality of the metadata, please let us know by using the 'report' button and we will flag it for consideration.)
Drinking water comes from many different sources, including surface water and groundwater. …
Drinking water comes from many different sources, including surface water and groundwater. Environmental engineers analyze the physical properties of groundwater to predict how and where surface contaminants will travel. In this lesson, students will learn about several possible scenarios of contamination to drinking water. They will analyze the movement of example contaminants through groundwater such as environmental engineers must do (i.e., engineers identify and analyze existing contamination of water sources in order to produce high quality drinking water for consumers).
Students are introduced to the concept of a dam and its potential …
Students are introduced to the concept of a dam and its potential benefits, which include water supply, electricity generation, flood control, recreation and irrigation. This lesson begins an ongoing classroom scenario in which student engineering teams working for the Splash Engineering firm design dams for a fictitious client, Thirsty County.
If water covers 70-75% of our planet, then why should we be …
If water covers 70-75% of our planet, then why should we be concerned about water quality and conservation? This lesson helps students understand that 97% of our water is present on Earth in the form of salt water, and therefore, unavailable for helping support life on Earth. Another 2% of Earth's water is frozen, which leaves us approximately 1% in groundwater, lakes, streams, and water vapor. This lesson was adapted from a lesson series from 4-H SET (California) . This lesson results from a collaboration between the Alabama State Department of Education and ASTA.
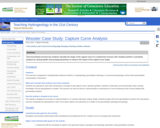
This exercise uses an analytical method (Grubb, 1993) and Excel to calculate …
This exercise uses an analytical method (Grubb, 1993) and Excel to calculate the capture zone shape for a TCE remediation well in Wooster, Ohio. The case study description given in an extensive PowerPoint presentation. The capture-zone equations are programmed by the student into an Excel worksheet and used to delineate the contributing area of a contaminant recovery well. Students can then experiment with by varying the pumping rate, hydraulic conductivity, and hydraulic gradient to better understand the sensitivity of these parameters on capture-zone shape.
(Note: this resource was added to OER Commons as part of a batch upload of over 2,200 records. If you notice an issue with the quality of the metadata, please let us know by using the 'report' button and we will flag it for consideration.)
No restrictions on your remixing, redistributing, or making derivative works. Give credit to the author, as required.
Your remixing, redistributing, or making derivatives works comes with some restrictions, including how it is shared.
Your redistributing comes with some restrictions. Do not remix or make derivative works.
Most restrictive license type. Prohibits most uses, sharing, and any changes.
Copyrighted materials, available under Fair Use and the TEACH Act for US-based educators, or other custom arrangements. Go to the resource provider to see their individual restrictions.